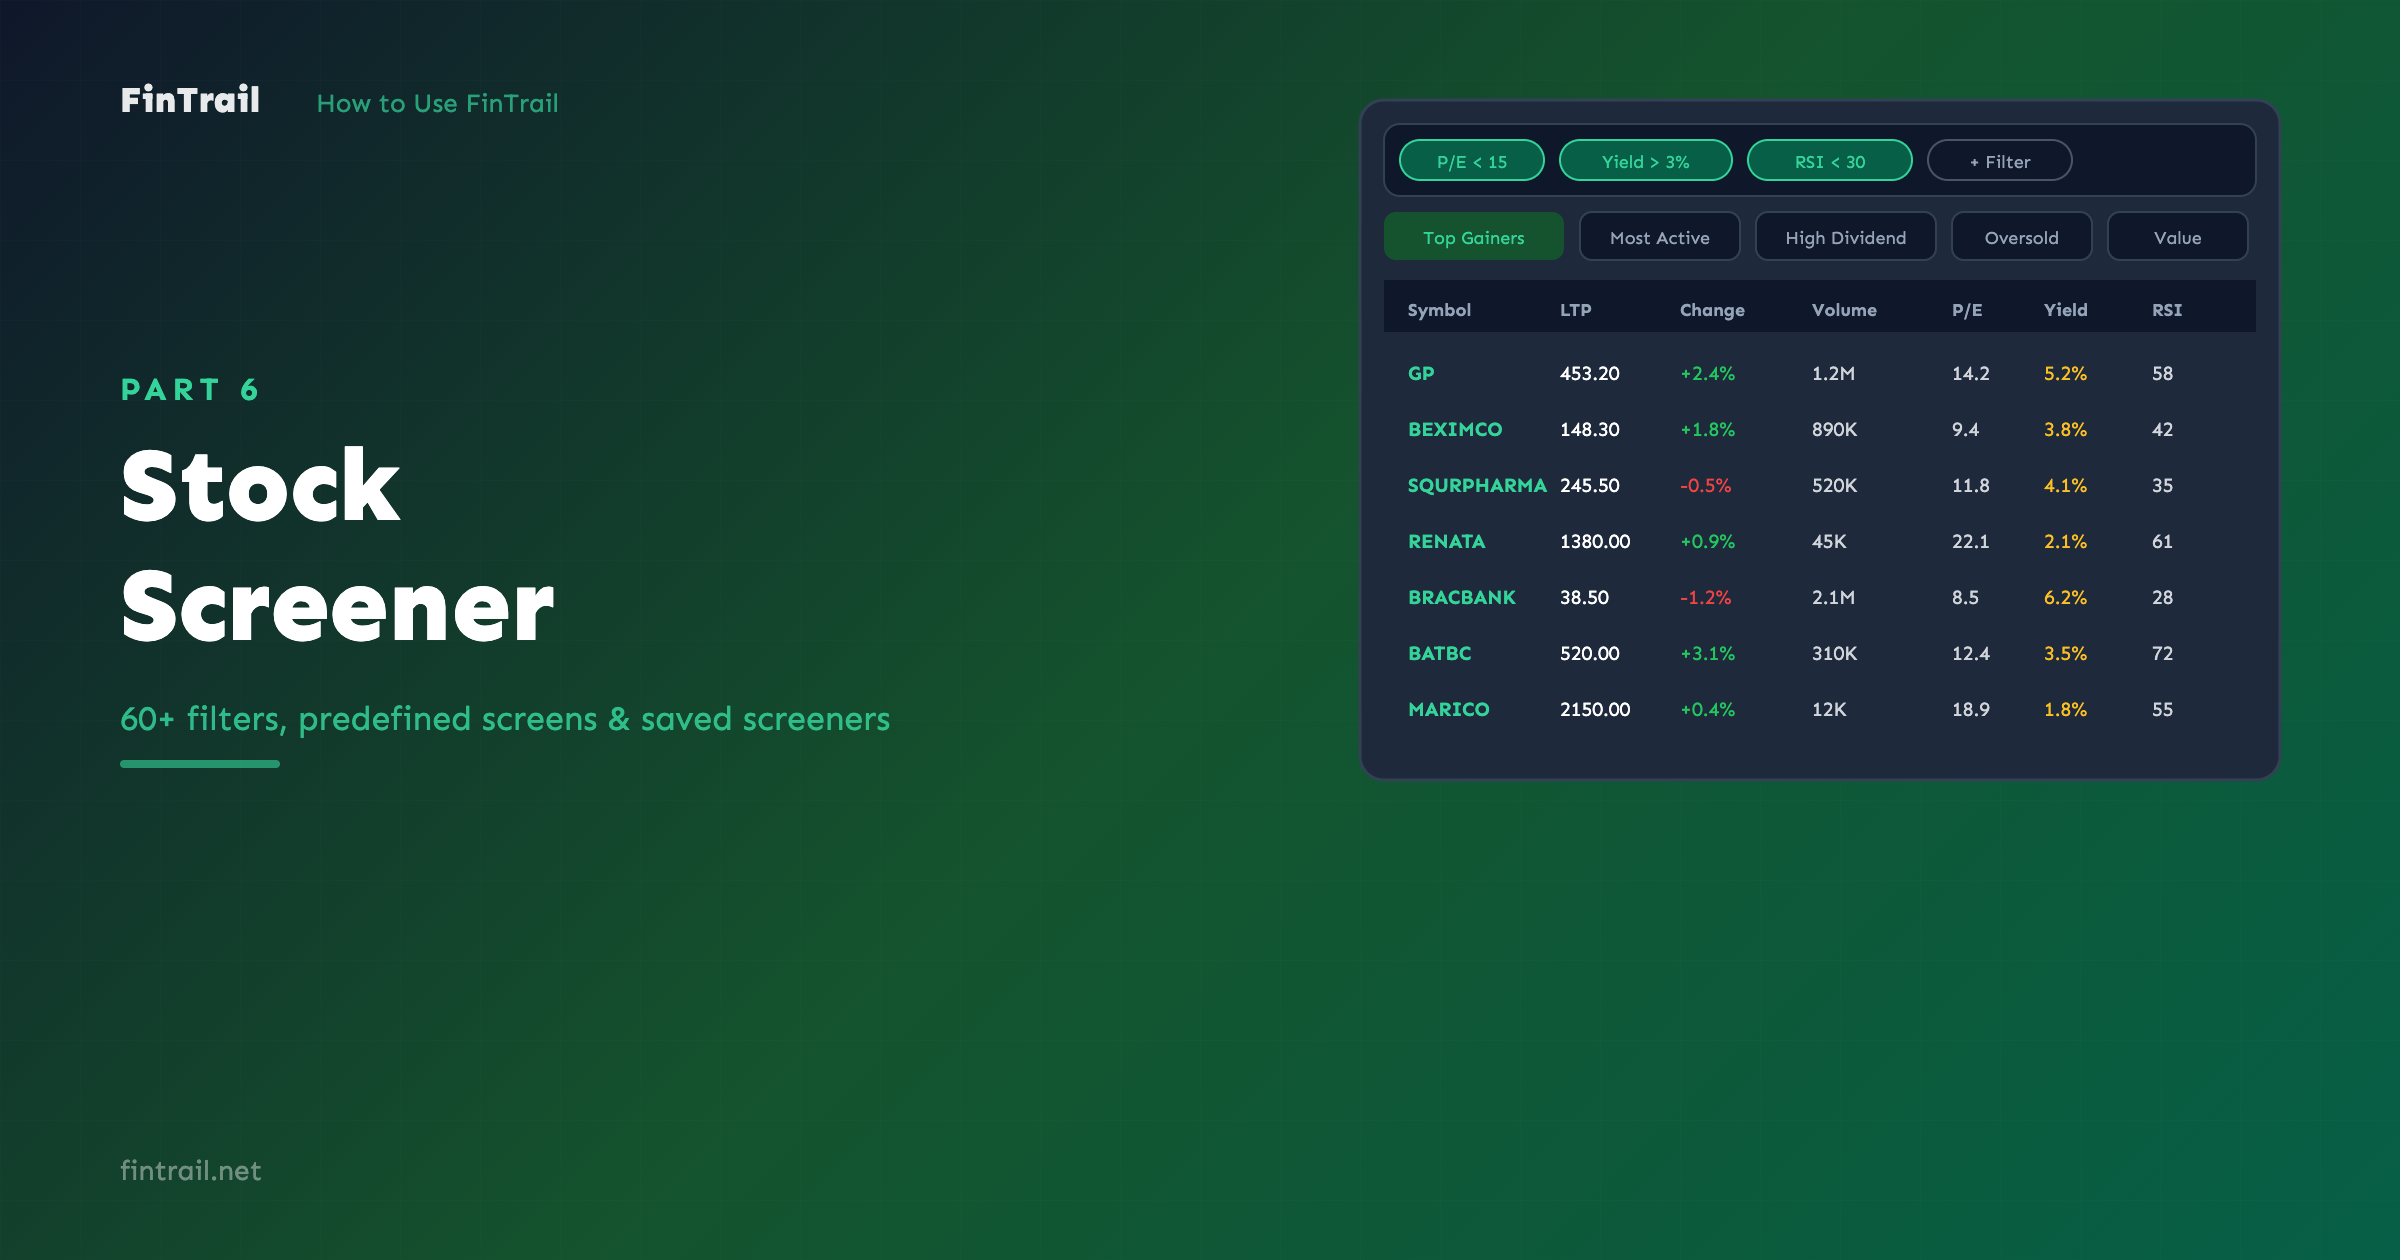
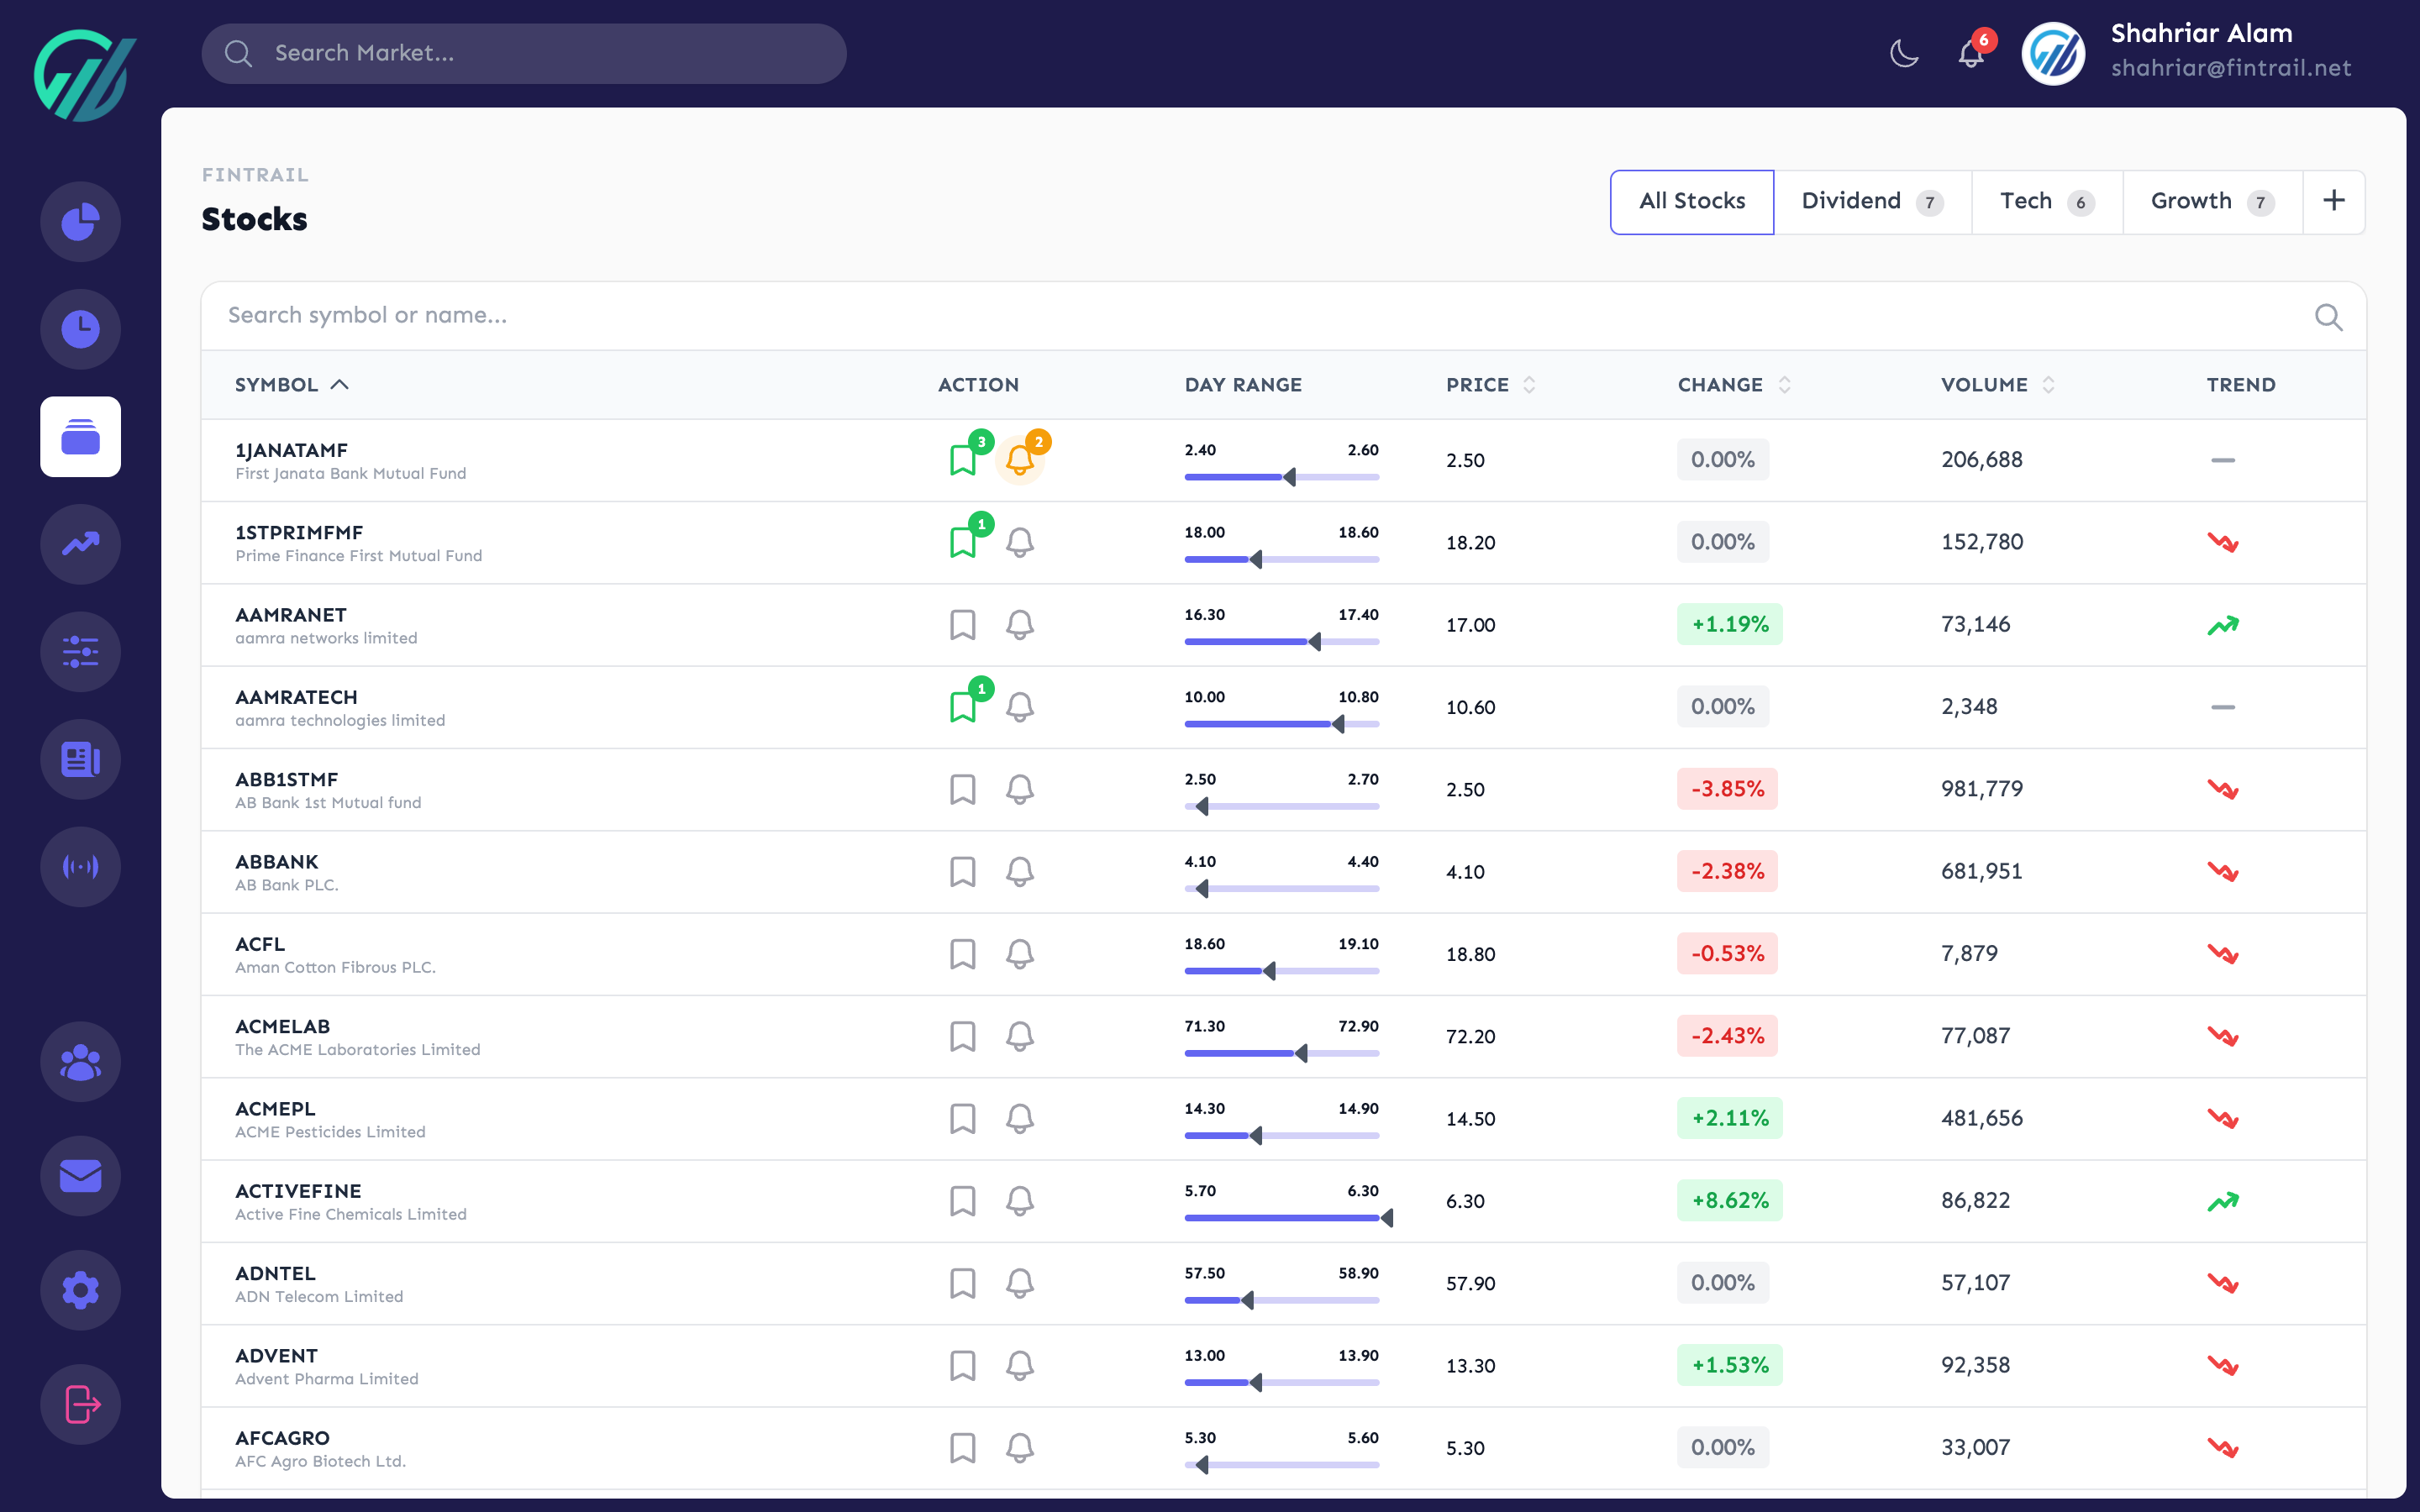
Not every stock you are interested in belongs in your portfolio. Some you want to watch before committing, others you want to monitor for the right entry point. FinTrail’s Stocks page lets you track all ~400 DSE-listed stocks with live prices, organize them into custom watchlists, and jump into deep analysis on any stock with a single click.
The Stocks Page
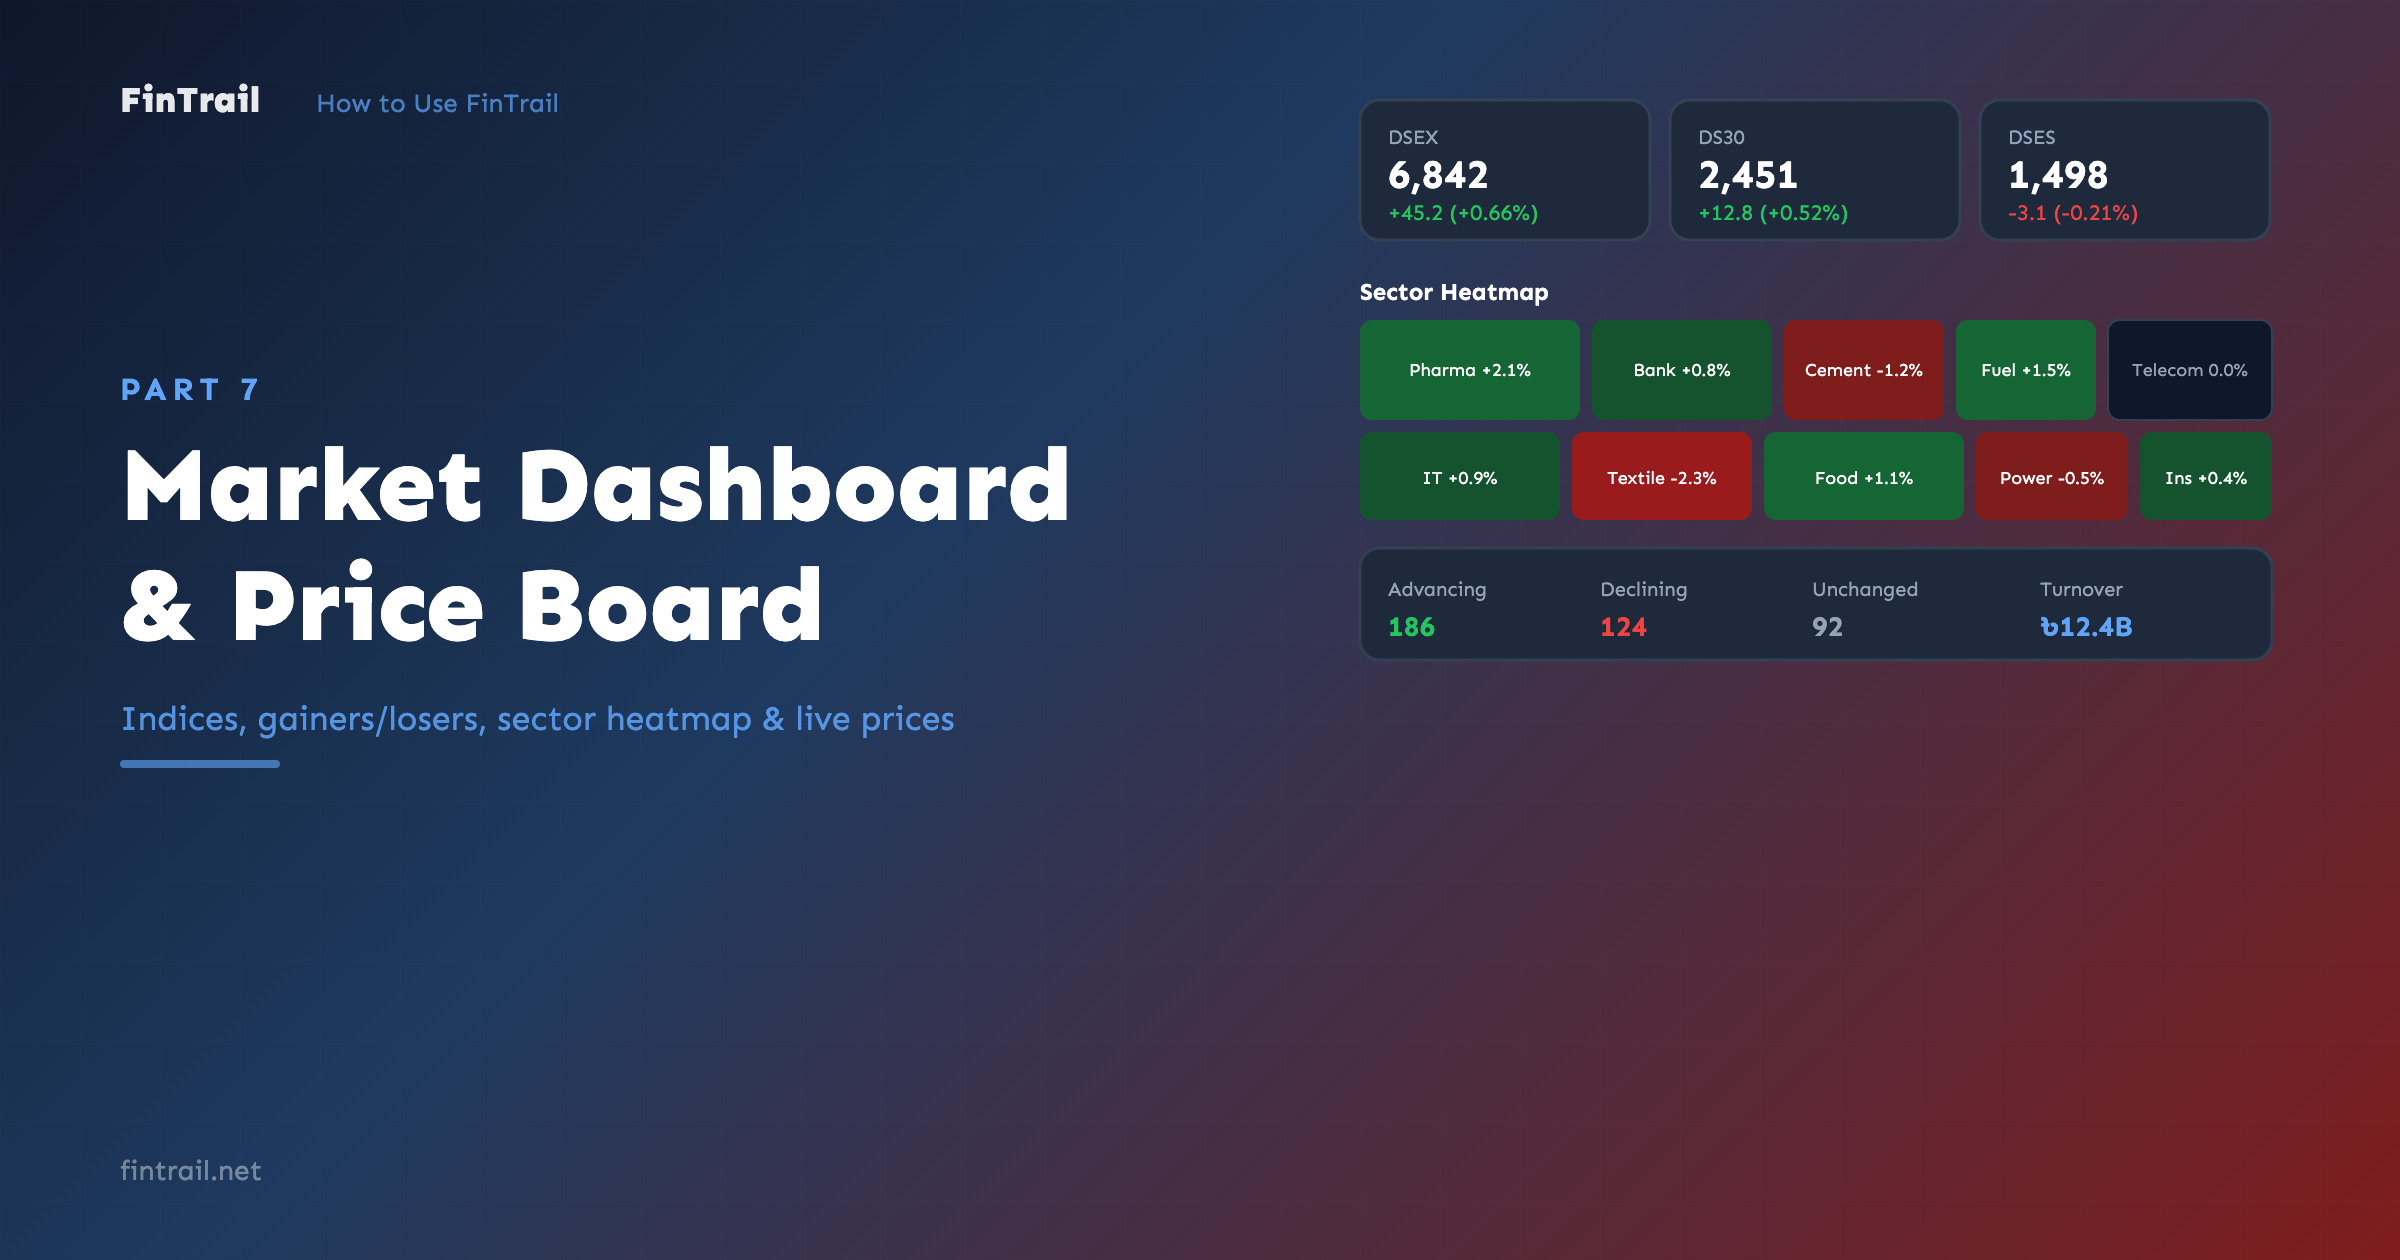
The Stocks page is your central hub for monitoring the market at the individual stock level. Every DSE-listed stock appears here with its current price, daily change, and trading volume — updated every 30 seconds during market hours.
By default, you see All Stocks. The table is searchable and sortable, so you can quickly find any stock by symbol or company name.
Creating Watchlists
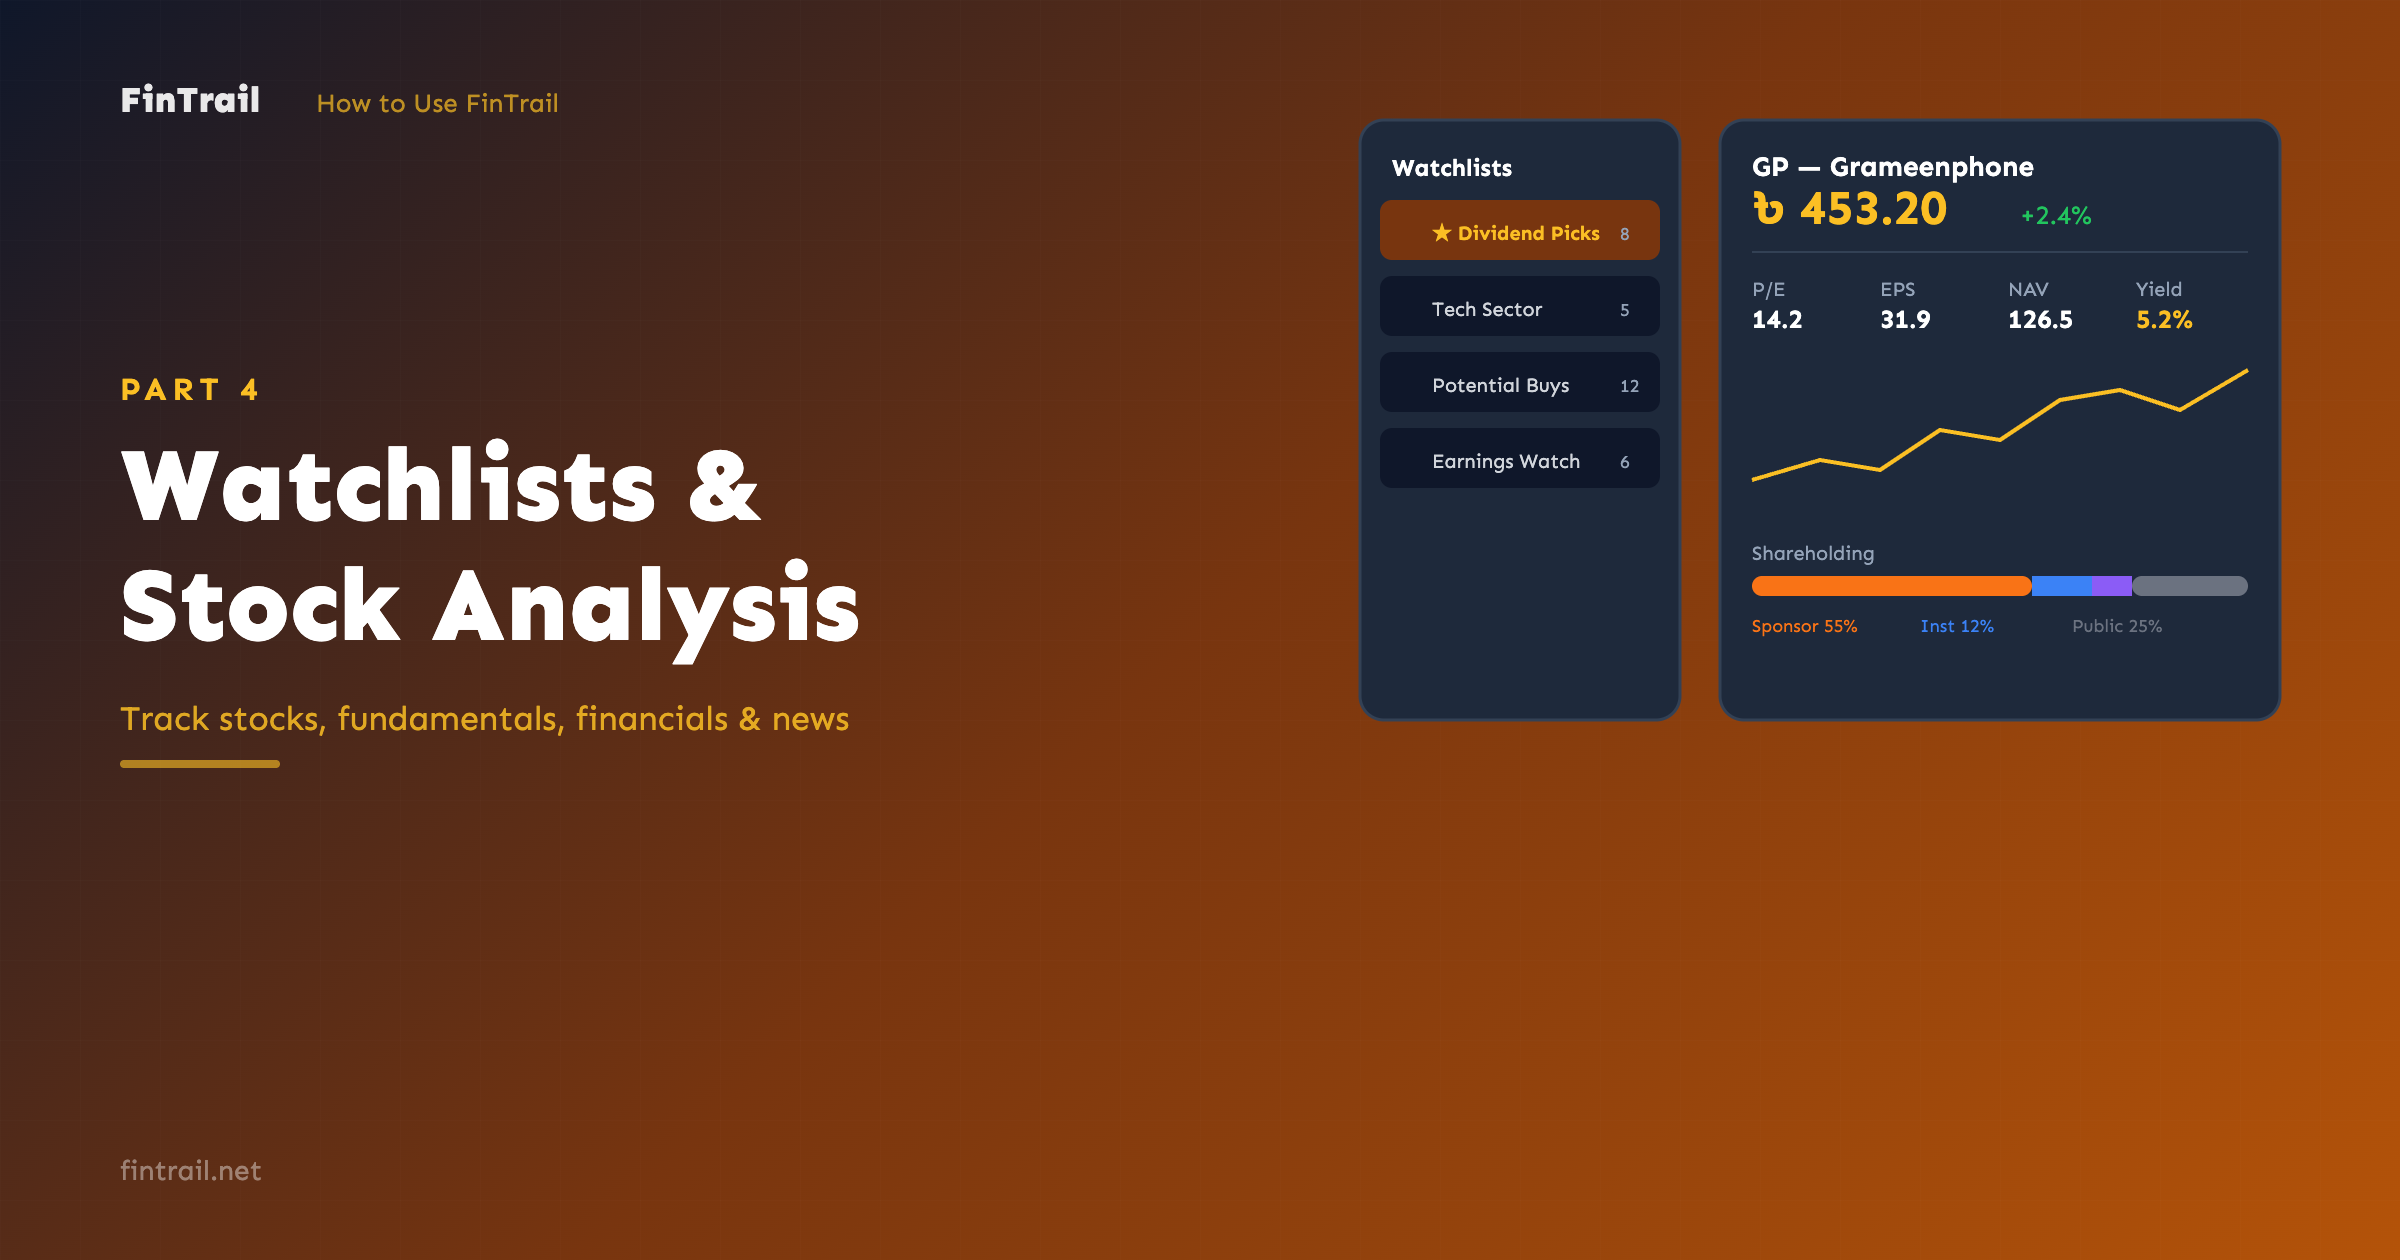
Watchlists let you group stocks you are monitoring. You might create lists like “Dividend Picks”, “Tech Sector”, “Potential Buys”, or “Earnings Watch”.
To create a watchlist:
- On the Stocks page, look for the watchlist panel on the left side.
- Type a name for your new list (up to 50 characters).
- Click create.
Your new list appears in the sidebar. Each list shows how many stocks it contains.
Adding Stocks to a Watchlist
There are two ways to add stocks:
- Quick add — when viewing a specific watchlist, click the add button next to any stock in the table. The stock gets added to the currently selected list.
- Multi-list add — click the watchlist icon on any stock to see all your lists and toggle which ones include that stock. A stock can belong to multiple watchlists.
Managing Your Lists
You can:
- Rename any watchlist
- Reorder watchlists by dragging them into your preferred order
- Delete a watchlist (this removes the list and its stock associations, but not the stocks themselves)
Switch between lists using the sidebar. When a specific watchlist is selected, the stock table filters to show only stocks in that list.
Setting Price Alerts from Stocks
While browsing, you can set a price alert for any stock directly from the Stocks page. Click the alert icon on a stock and configure:
- Condition — Price Above, Price Below, Percentage Change Up, or Percentage Change Down
- Target value — the price or percentage threshold
- Notification channels — Web Push (on by default), Email, Telegram, or Discord
- Recurring — toggle whether the alert fires once or every time the condition is met
We cover alerts in more detail in Part 8.
Stock Analysis
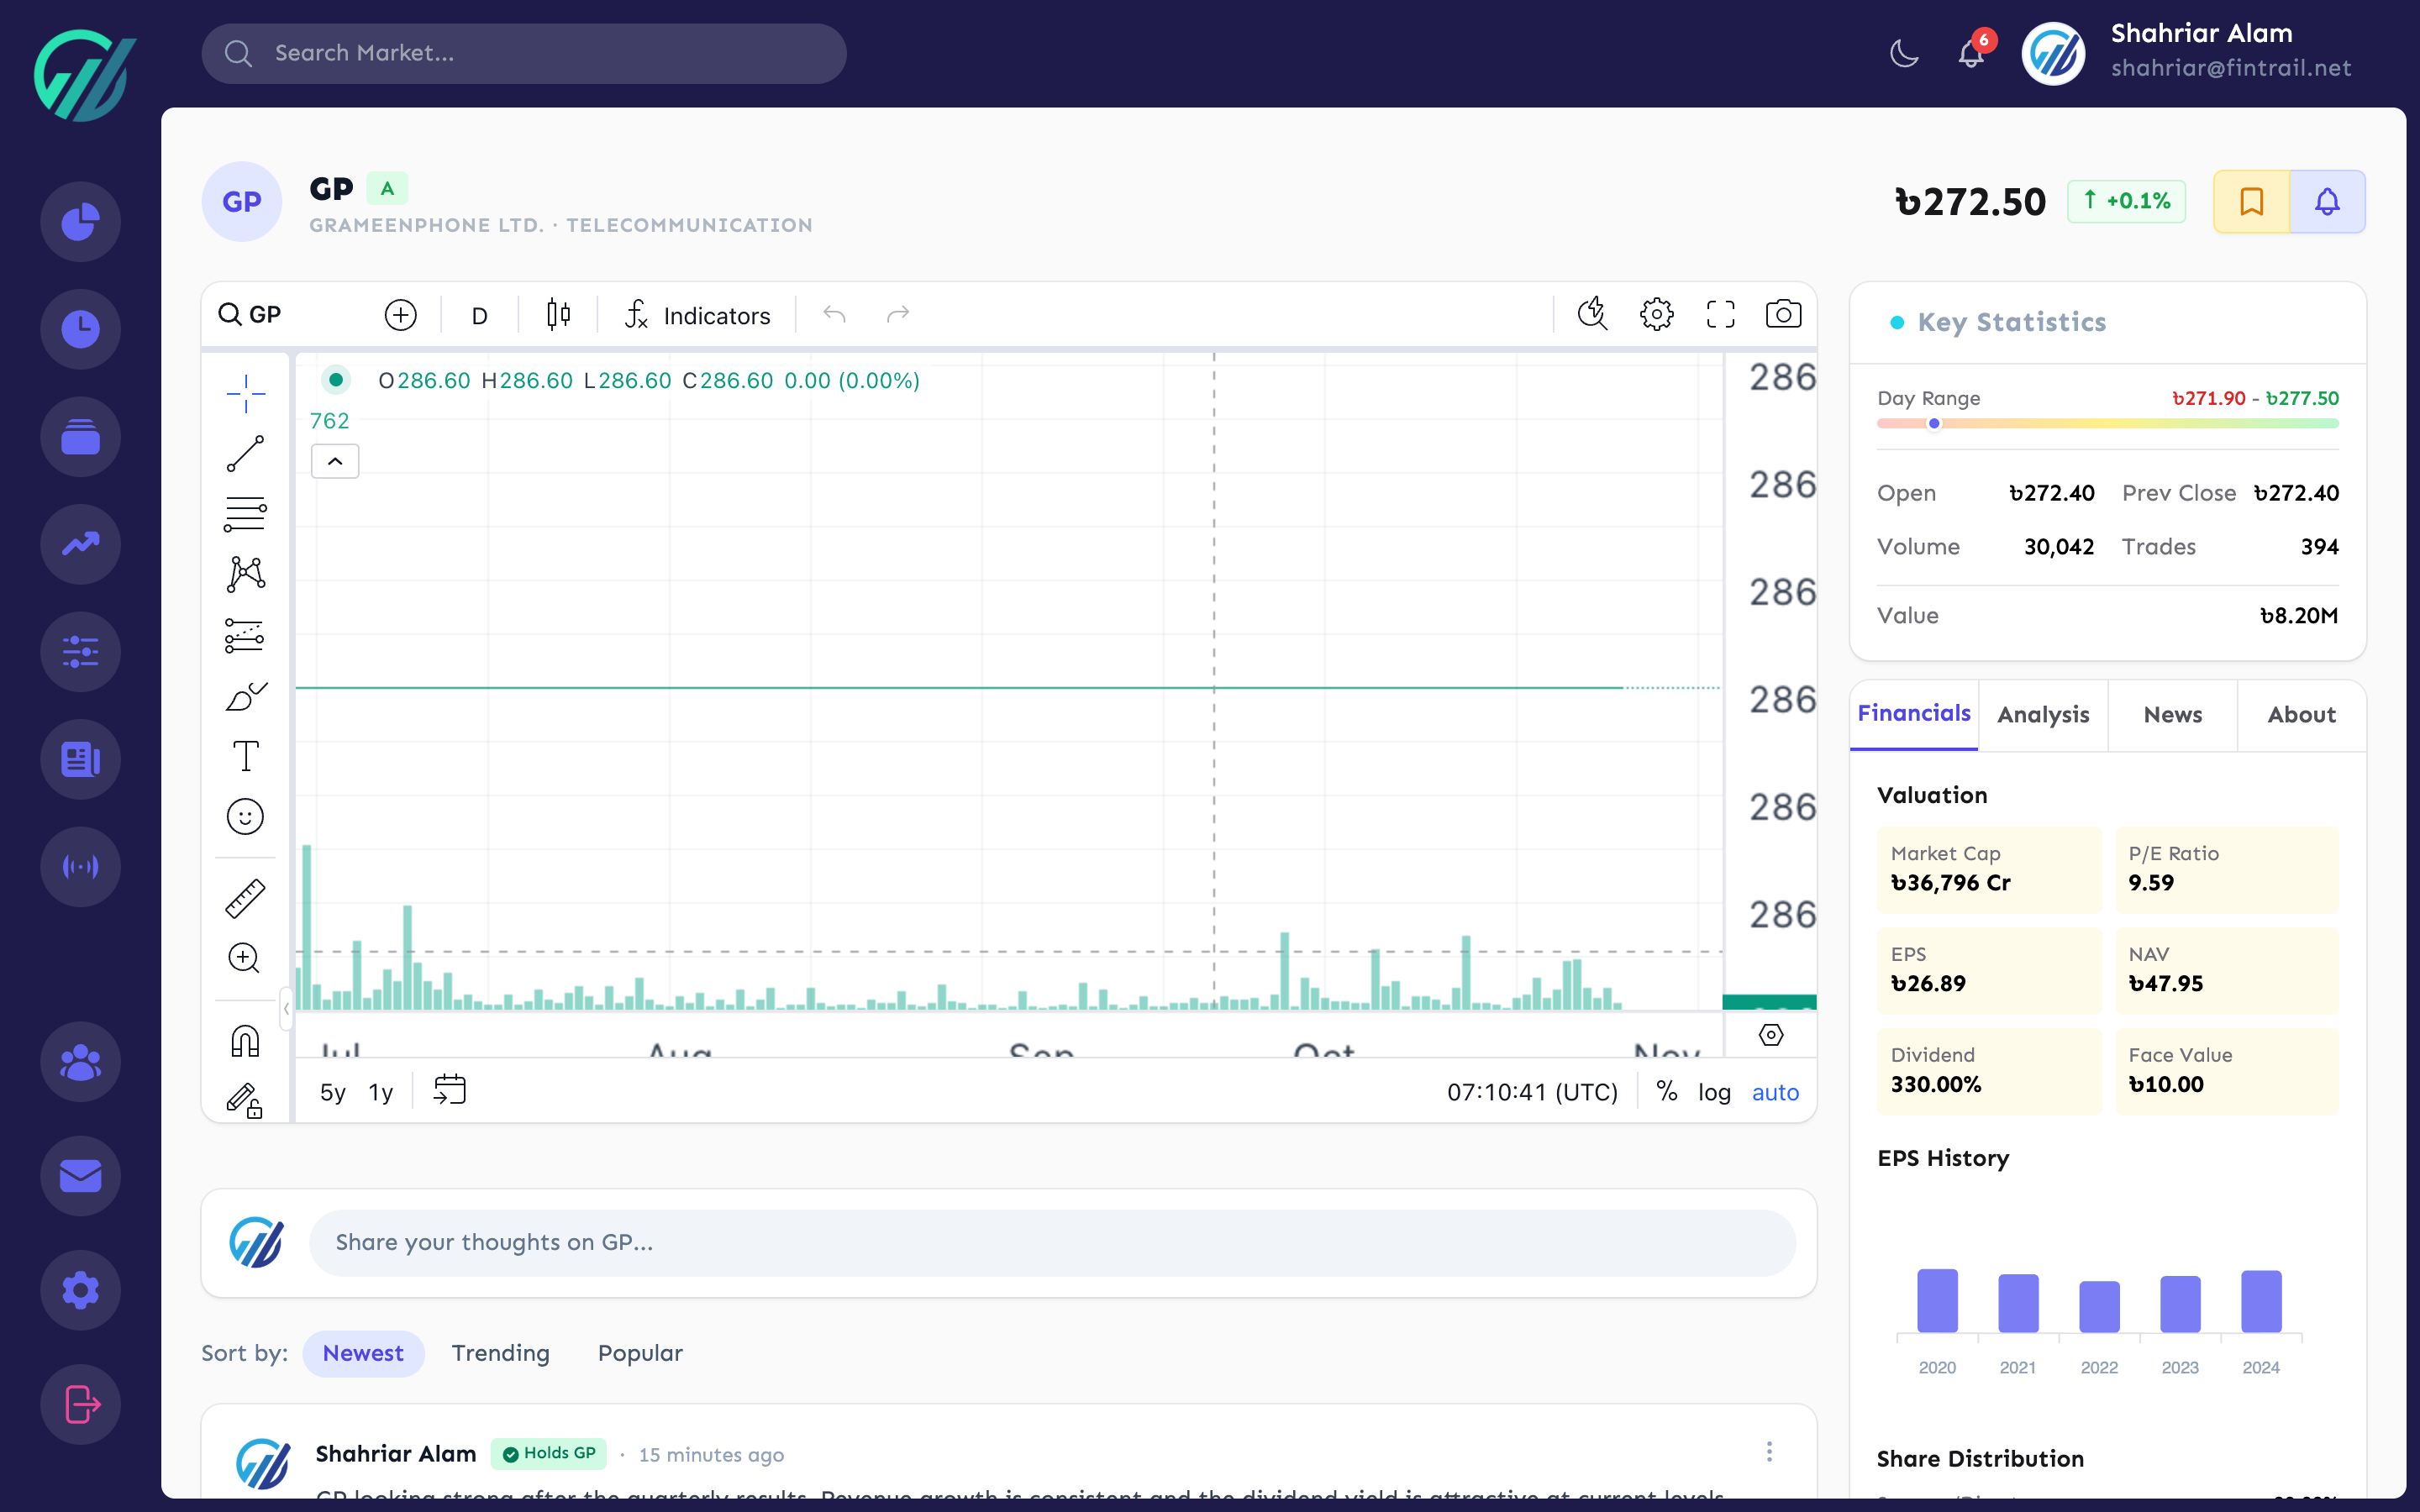
Click any stock symbol — either from the Stocks page, your portfolio, or anywhere else in FinTrail — to open its dedicated Analysis page. This is where you get the full picture of a stock.
Price Overview
At the top of the analysis page, you see:
- Last Traded Price (LTP) — the current price with change amount and percentage
- Day’s Range — high and low prices for the day
- Yesterday’s Close (YCP) — the previous day’s closing price
- Volume — total shares traded today
- Trade Count — number of individual trades
- Trade Value — total value of all trades in BDT

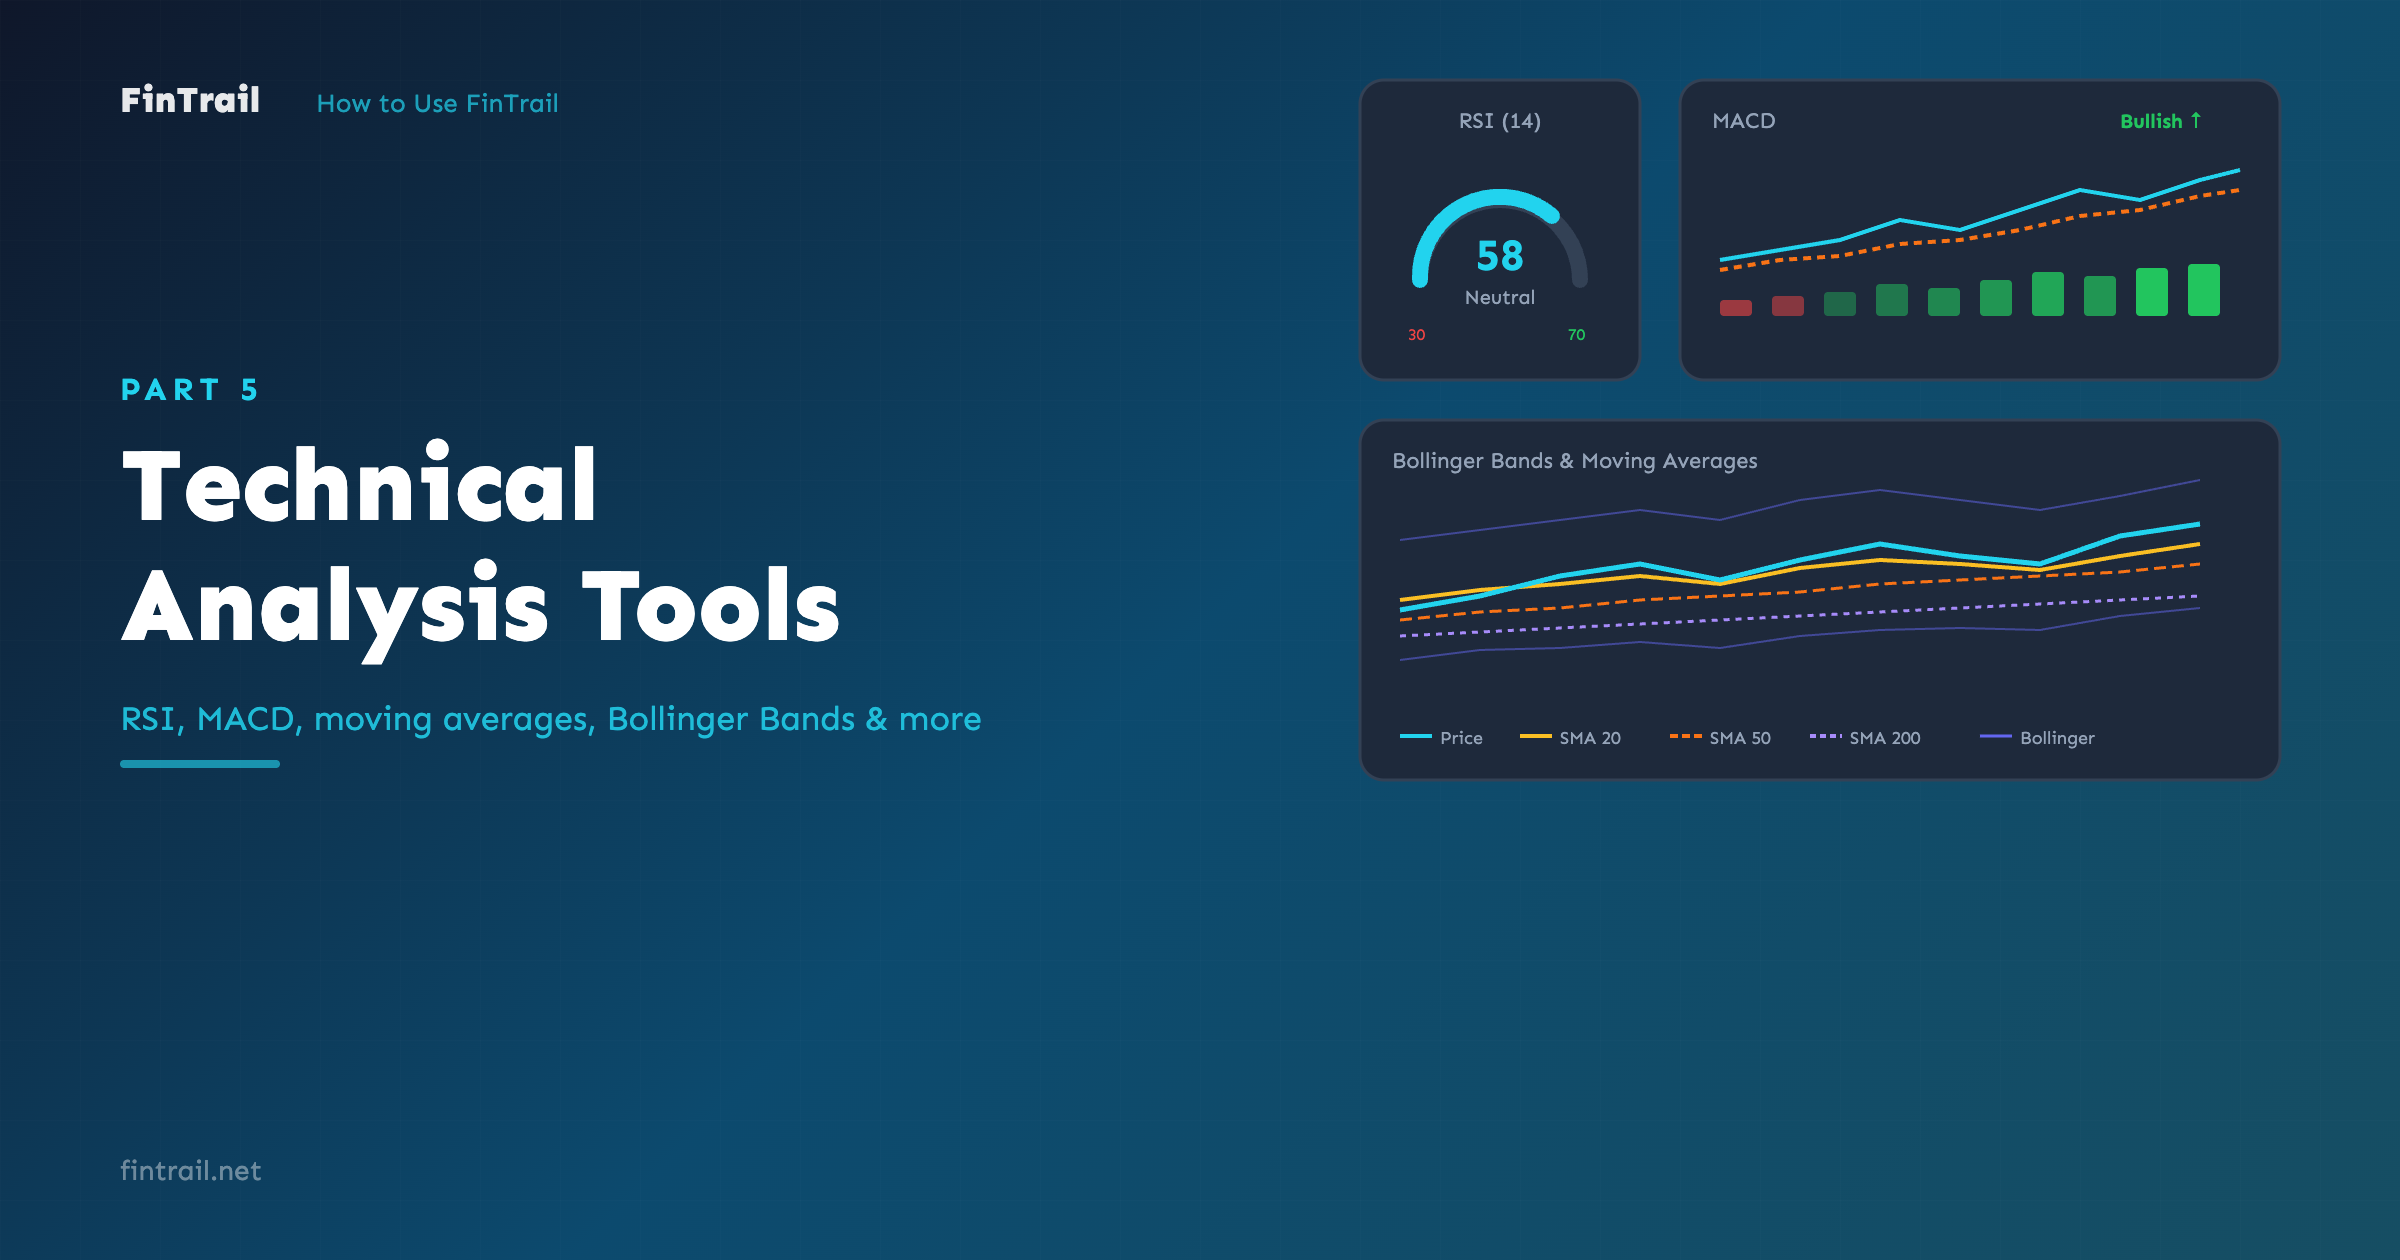
Interactive Chart
The TradingView-powered chart gives you access to 13+ years of historical price and volume data. You can:
- Switch between timeframes (daily, weekly, monthly)
- Use drawing tools for trendlines and annotations
- Overlay technical indicators directly on the chart
- Toggle between candlestick and other chart types
Fundamental Data
The fundamentals section breaks down the company’s financial health:
- Valuation — P/E ratio, EPS, NAV, and Market Cap
- Dividends — dividend percentage and dividend yield
- Capital Structure — face value, total shares, authorized and paid-up capital, listing year
- 52-Week Range — highest and lowest prices over the past year
- Average Volume — typical daily trading volume
Shareholding Breakdown
A percentage breakdown of who owns the company’s shares:
- Sponsor/Director holdings
- Government holdings
- Institutional holdings
- Foreign holdings
- Public (retail investor) holdings
This is useful for gauging ownership concentration. High sponsor ownership often signals management confidence, while increasing foreign or institutional holdings can indicate growing interest from larger players.
Financial History
Up to 5 years of annual financial data, sorted by most recent year first. This lets you spot trends in revenue, earnings, and other key metrics over time.
News & Announcements
The last 10 news items and corporate announcements for the stock, sourced from DSE. Each item shows the headline, date, category (Dividend, Financials, AGM/EGM, etc.), and whether it is price-sensitive.
Quick Actions from Analysis
Without leaving the analysis page, you can:
- Add to watchlist — toggle the stock into any of your watchlists
- Set a price alert — same alert configuration as the Stocks page
- Buy — jump directly to the buy form (if you have an active portfolio selected)
What is Next
Now you know how to organize stocks with watchlists and dig into any stock’s fundamentals and financials. In Part 5, we take a closer look at the technical analysis tools — RSI, MACD, moving averages, Bollinger Bands, and more — and how to read the signals FinTrail calculates for you.
This is Part 4 of the How to Use FinTrail series. ← Previous: Portfolio Details & Trade History. Continue to Part 5: Technical Analysis Tools.