FinTrail calculates technical indicators for every DSE stock automatically. You do not need to manually compute anything — just open any stock’s Analysis page and scroll to the Technicals section. This guide explains what each indicator means and how to read the signals.
Where to Find Technicals
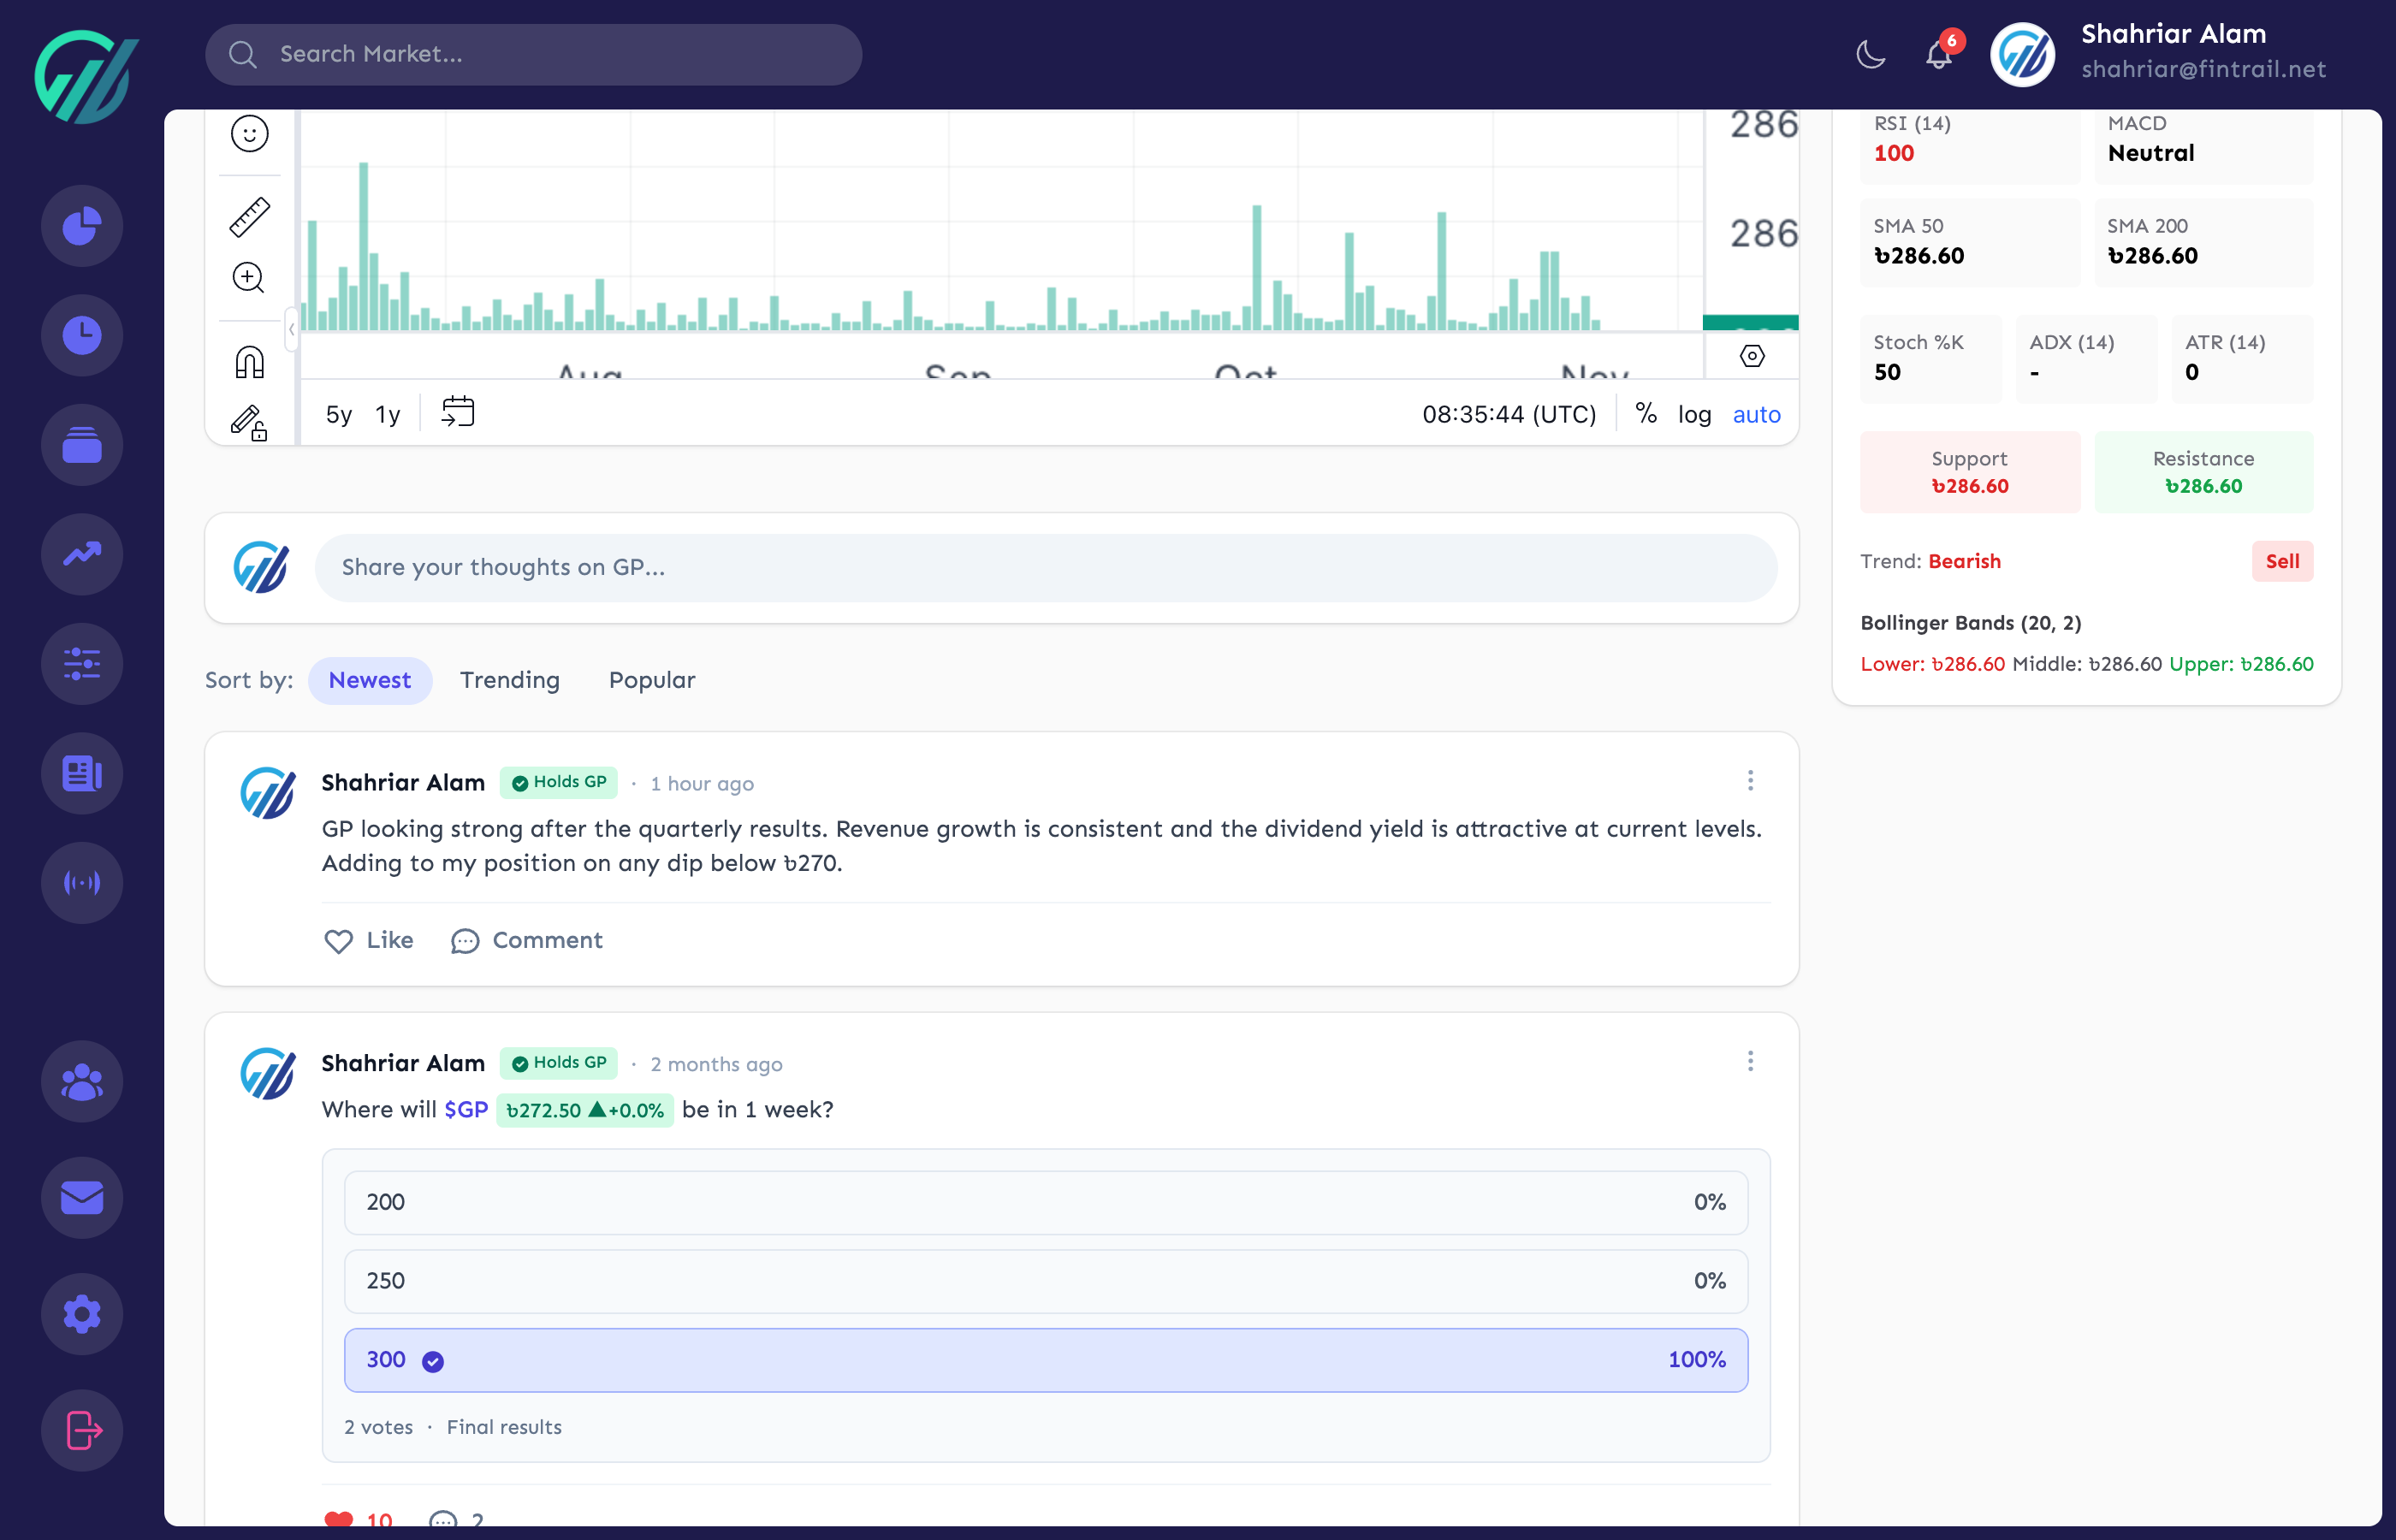
Open any stock’s Analysis page by clicking its symbol anywhere in FinTrail. The technicals section shows all calculated indicators along with an overall signal (Bullish, Bearish, or Neutral) based on the price’s relationship to key moving averages.
Trend & Signal
At the top of the technicals section, FinTrail shows:
-
Trend — determined by comparing the current price to the 50-day and 200-day simple moving averages:
- Uptrend — price above SMA 50, and SMA 50 above SMA 200
- Downtrend — price below SMA 50, and SMA 50 below SMA 200
- Bullish — price above SMA 200 but not in a full uptrend
- Bearish — price below SMA 200 but not in a full downtrend
- Neutral — insufficient data to determine
-
Signal — a daily signal combining multiple indicator readings
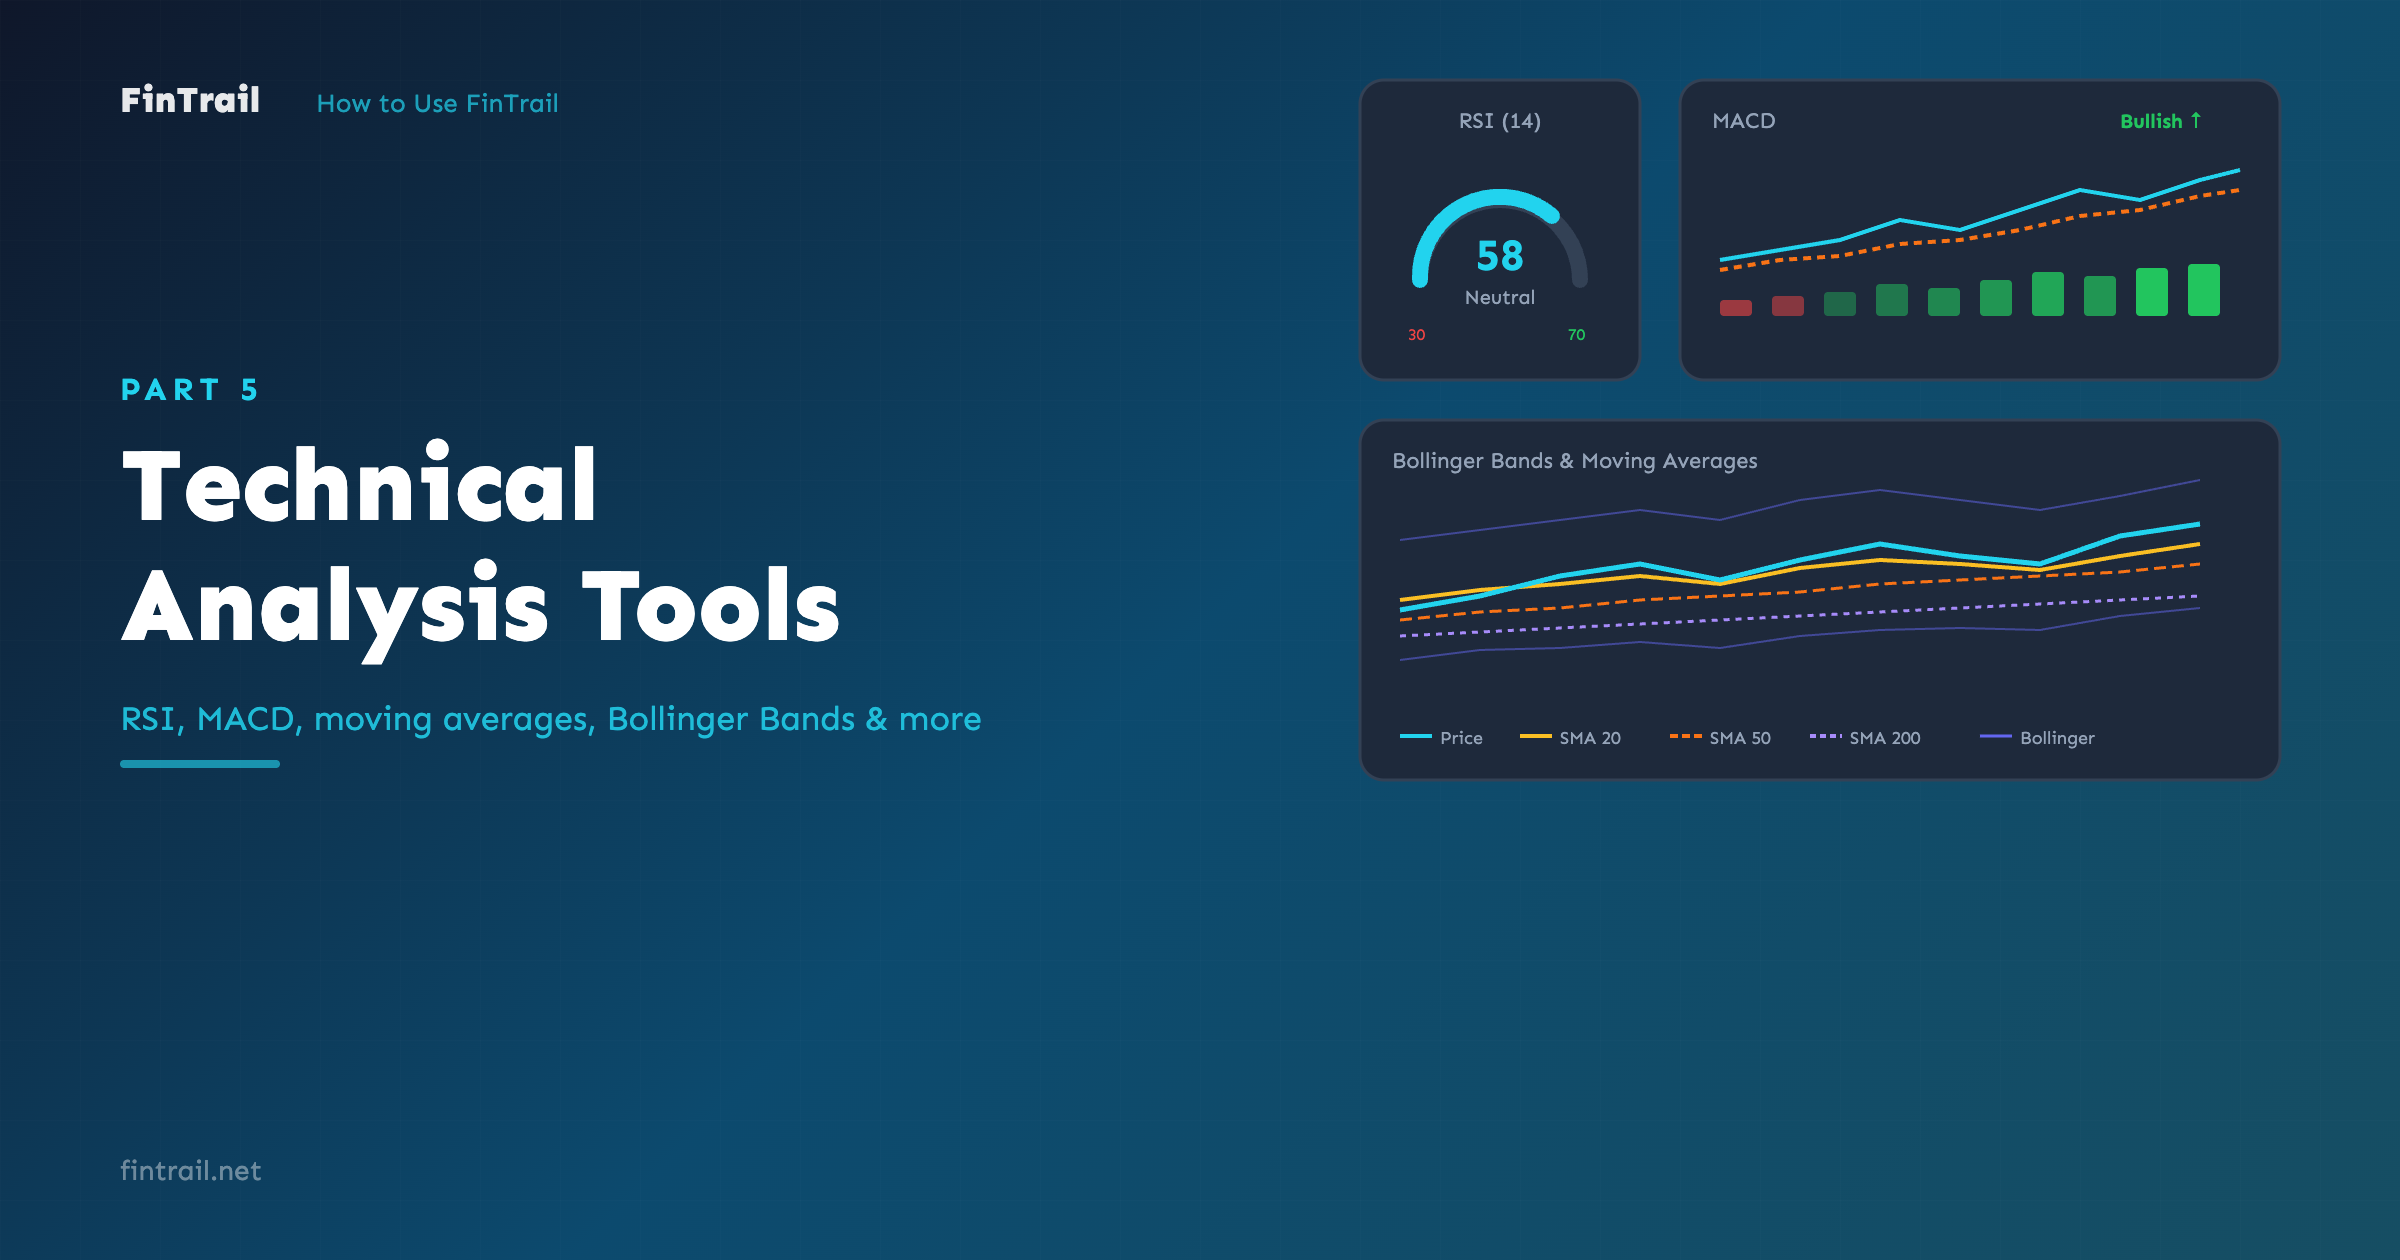
RSI (Relative Strength Index)
RSI measures momentum on a scale of 0 to 100. FinTrail calculates the 14-day RSI.
- Above 70 — the stock may be overbought (potentially overvalued, could pull back)
- Below 30 — the stock may be oversold (potentially undervalued, could bounce)
- Between 30–70 — neutral zone
RSI is best used as a confirmation signal, not in isolation. An oversold RSI on a fundamentally strong stock can be a buying signal, while an overbought RSI on a weak stock might confirm it is time to exit.
MACD (Moving Average Convergence Divergence)
MACD tracks the relationship between two moving averages. FinTrail shows four MACD components:
- MACD Line — the difference between the 12-day and 26-day exponential moving averages
- Signal Line — 9-day EMA of the MACD line
- Histogram — visual representation of the gap between MACD and Signal lines
- Trend reading — FinTrail interprets the MACD state:
- Bullish — MACD above signal with positive histogram
- Bearish — MACD below signal with negative histogram
- Weakening — positive histogram but MACD falling toward signal
- Recovering — negative histogram but MACD rising toward signal
When the MACD line crosses above the signal line, it is a bullish crossover. When it crosses below, it is bearish.
Moving Averages
FinTrail calculates both Simple Moving Averages (SMA) and Exponential Moving Averages (EMA):
- SMA 20 — short-term trend (approximately one month)
- SMA 50 — medium-term trend
- SMA 200 — long-term trend
- EMA 20 and EMA 50 — faster-reacting versions that give more weight to recent prices
Key signals:
- Price above a moving average suggests an uptrend at that timeframe
- Price below suggests a downtrend
- Golden Cross — SMA 50 crosses above SMA 200 (long-term bullish signal)
- Death Cross — SMA 50 crosses below SMA 200 (long-term bearish signal)
Bollinger Bands
Three lines that create a price channel:
- Upper Band — SMA 20 plus 2 standard deviations
- Middle Band — SMA 20 (the baseline)
- Lower Band — SMA 20 minus 2 standard deviations
FinTrail also derives support and resistance levels from Bollinger Bands. When the price touches the lower band, it can act as support. When it touches the upper band, it can act as resistance.
- Price near upper band — stock may be stretched and due for a pullback
- Price near lower band — stock may be compressed and due for a bounce
- Bands widening — volatility is increasing
- Bands narrowing (squeeze) — volatility is decreasing, a big move may follow
Stochastic Oscillator
Measures where the current price sits within its recent range, using two lines:
- %K — the fast stochastic line
- %D — the smoothed (slow) line
Readings range from 0 to 100:
- Above 80 — overbought zone
- Below 20 — oversold zone
- Bullish signal — %K crosses above %D in the oversold zone
- Bearish signal — %K crosses below %D in the overbought zone
ADX (Average Directional Index)
ADX measures the strength of a trend, regardless of direction. FinTrail calculates the 14-day ADX.
- Below 20 — weak or no trend (range-bound market)
- 20–40 — developing trend
- Above 40 — strong trend
ADX does not tell you the direction — just how strong the trend is. Combine it with other indicators (like MACD or moving averages) to know whether the strong trend is up or down.
ATR (Average True Range)
ATR measures volatility — how much a stock’s price typically moves in a day. FinTrail calculates the 14-day ATR.
- Higher ATR means more volatile (wider daily price swings)
- Lower ATR means calmer trading
ATR is useful for setting stop-loss levels. A common approach is placing your stop-loss at 1.5–2x ATR below your entry price.
Williams %R
Similar to Stochastic, Williams %R measures where the current price falls within the high-low range. It ranges from -100 to 0.
- Above -20 — overbought
- Below -80 — oversold
CCI (Commodity Channel Index)
Despite the name, CCI works for stocks too. FinTrail calculates the 20-day CCI.
- Above +100 — potentially overbought
- Below -100 — potentially oversold
- Between -100 and +100 — normal range
Combining Indicators
No single indicator tells the complete story. The most reliable signals come when multiple indicators agree:
- RSI oversold + MACD bullish crossover + price near Bollinger lower band = stronger buy signal
- RSI overbought + MACD bearish crossover + price near Bollinger upper band = stronger sell signal
- Strong ADX + clear trend direction from moving averages = high confidence in the trend continuing
FinTrail’s overall Signal reading already factors in multiple indicators, giving you a quick summary. But understanding the individual components helps you make more informed decisions.
What is Next
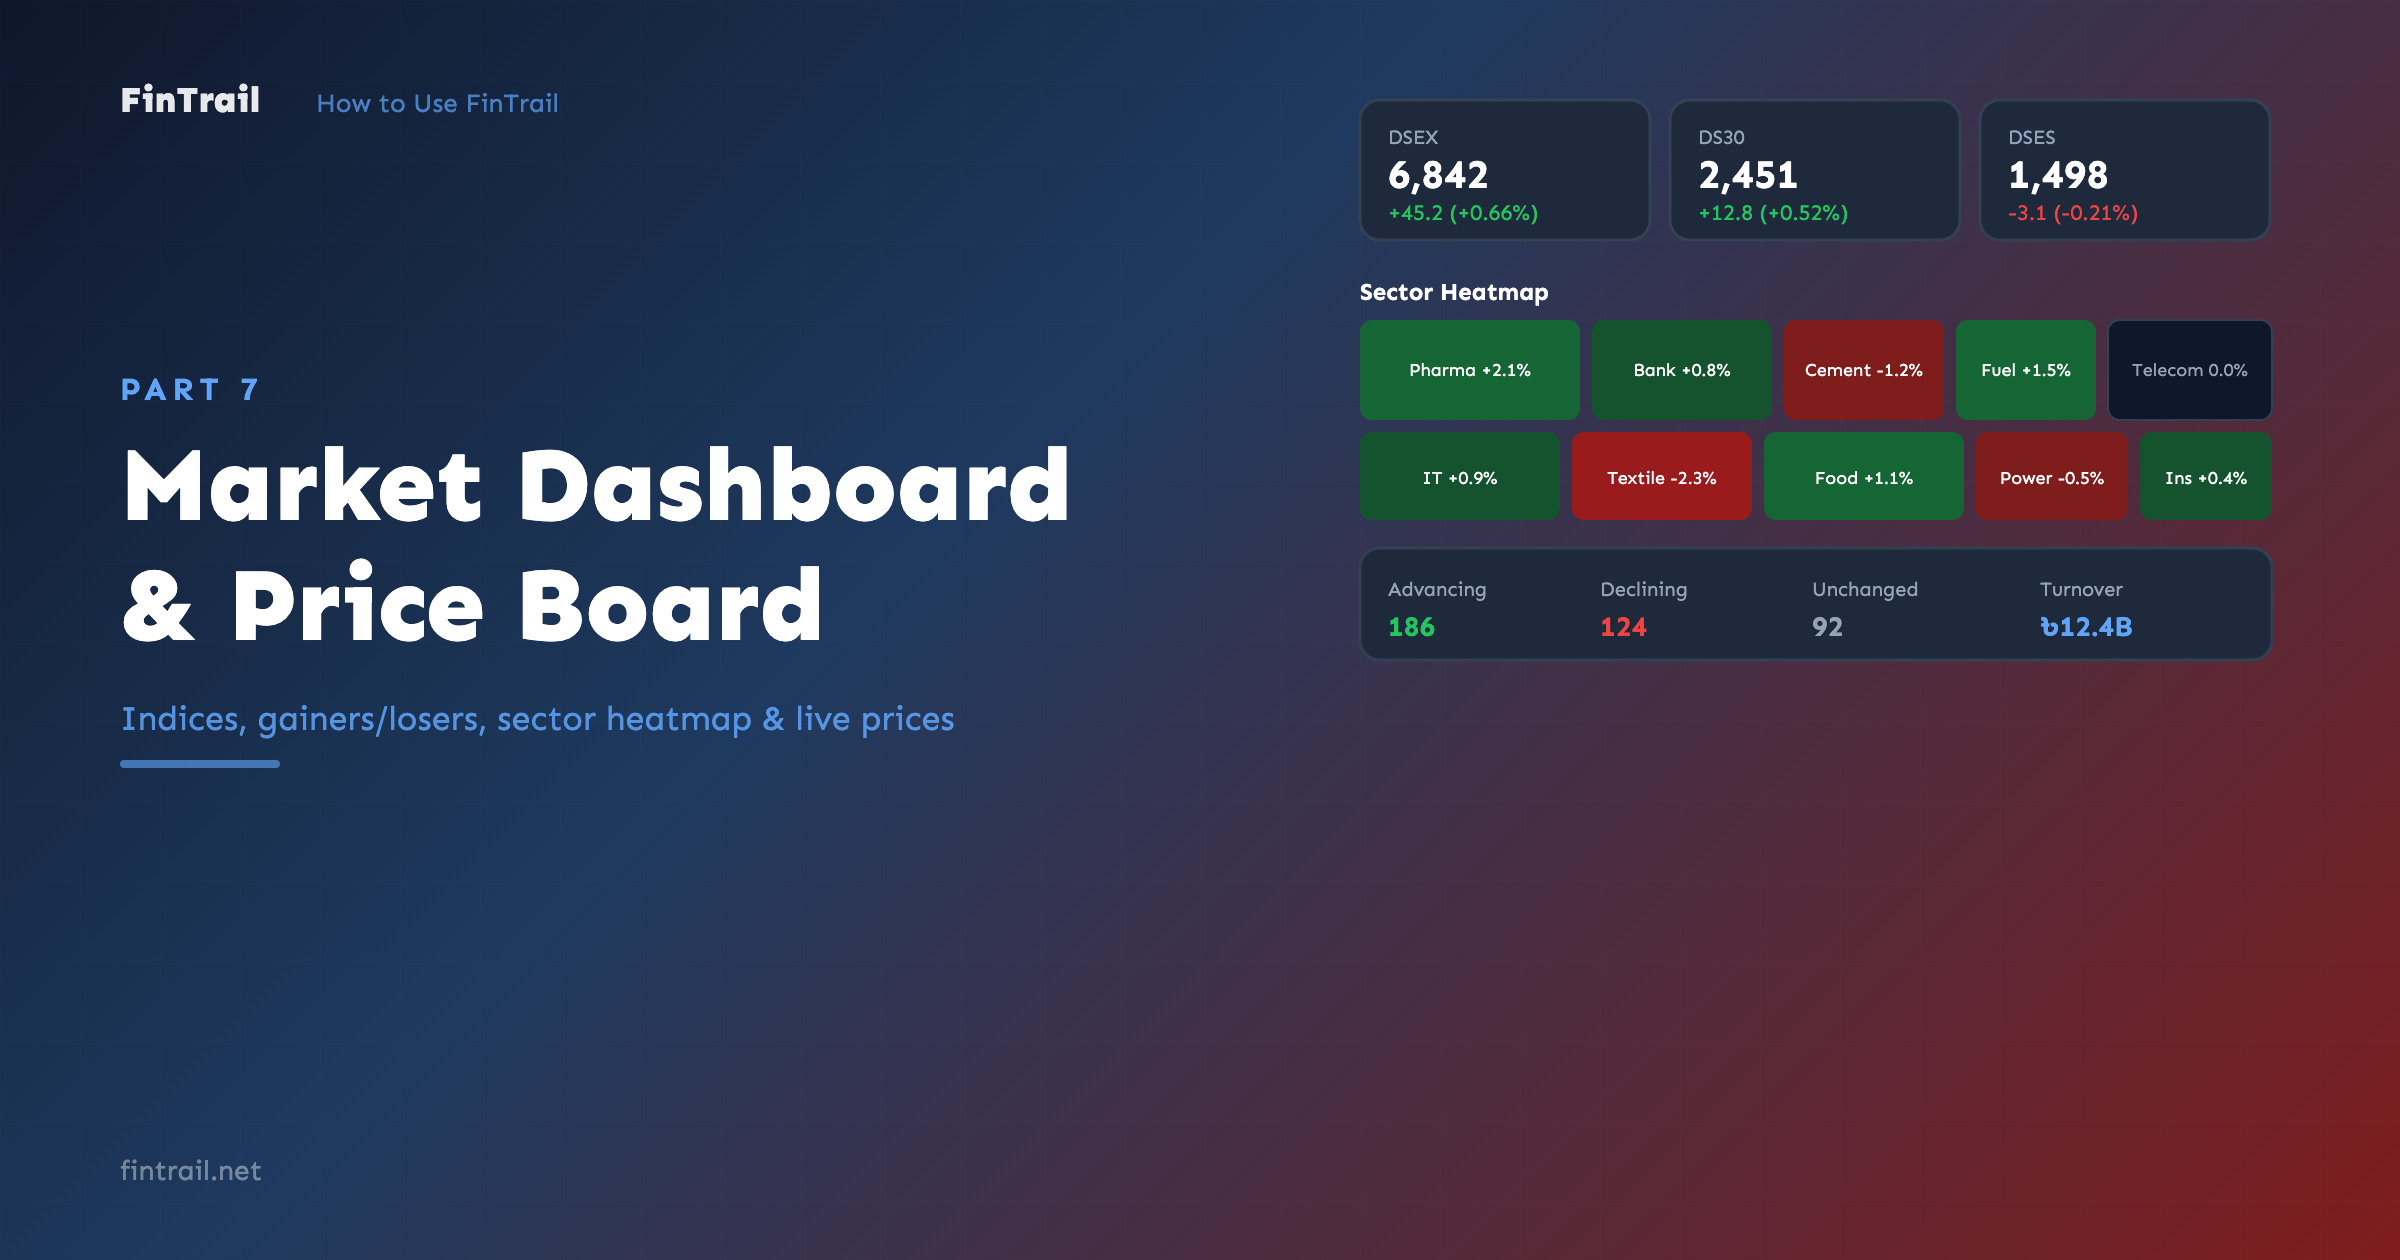
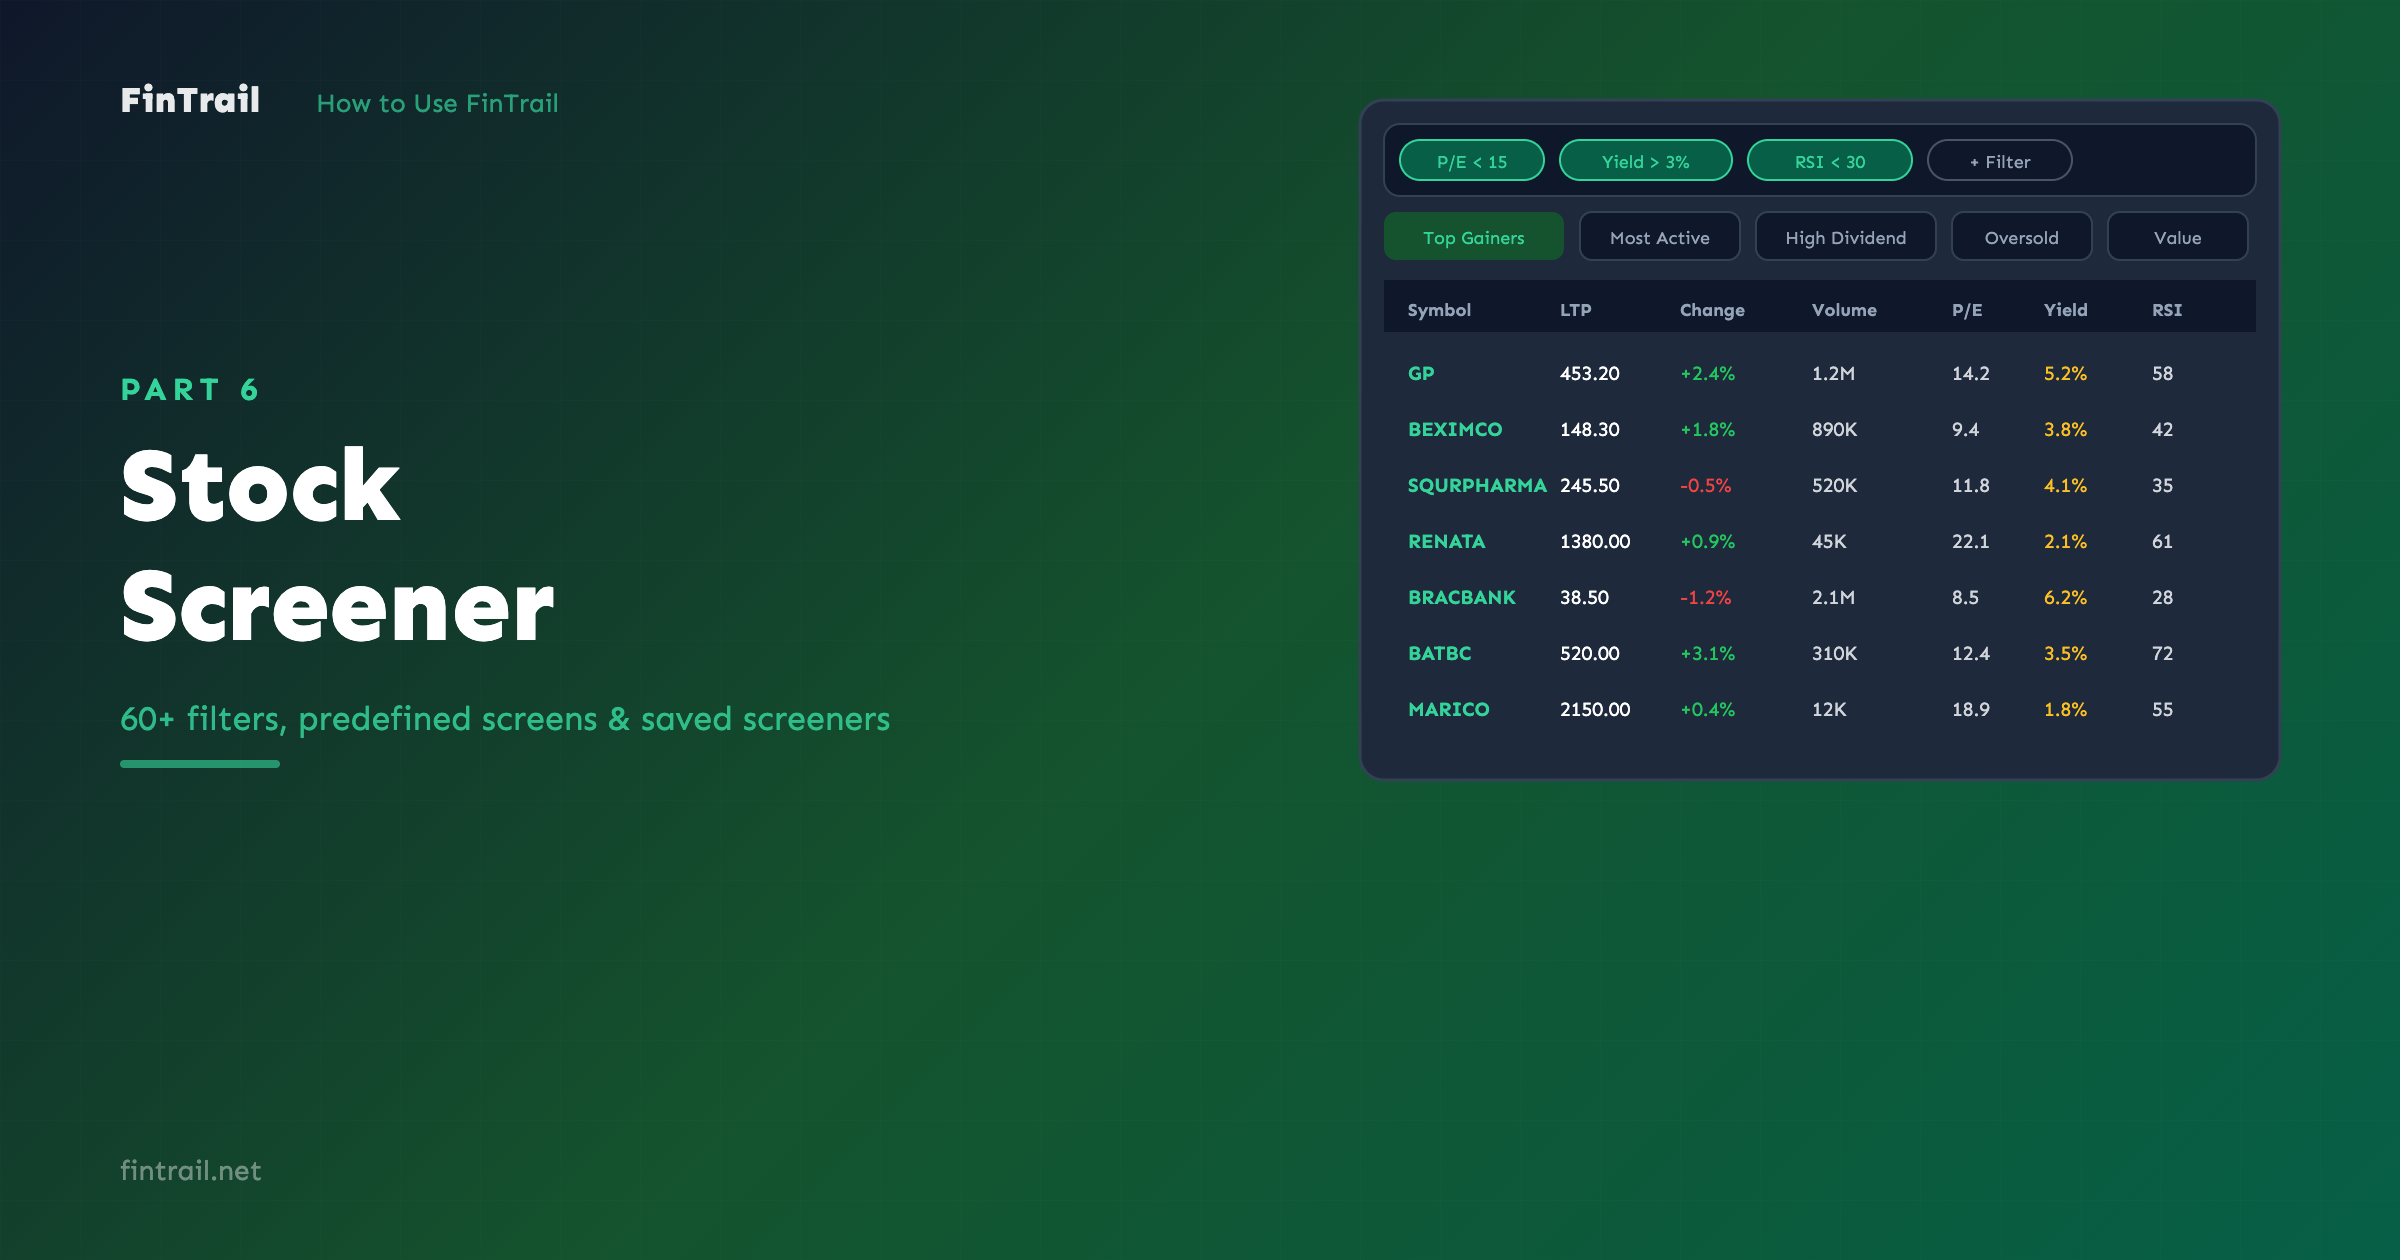
Now that you understand the technical tools, Part 6 covers the Stock Screener — how to filter all DSE stocks using 60+ criteria including the technical indicators we just covered.
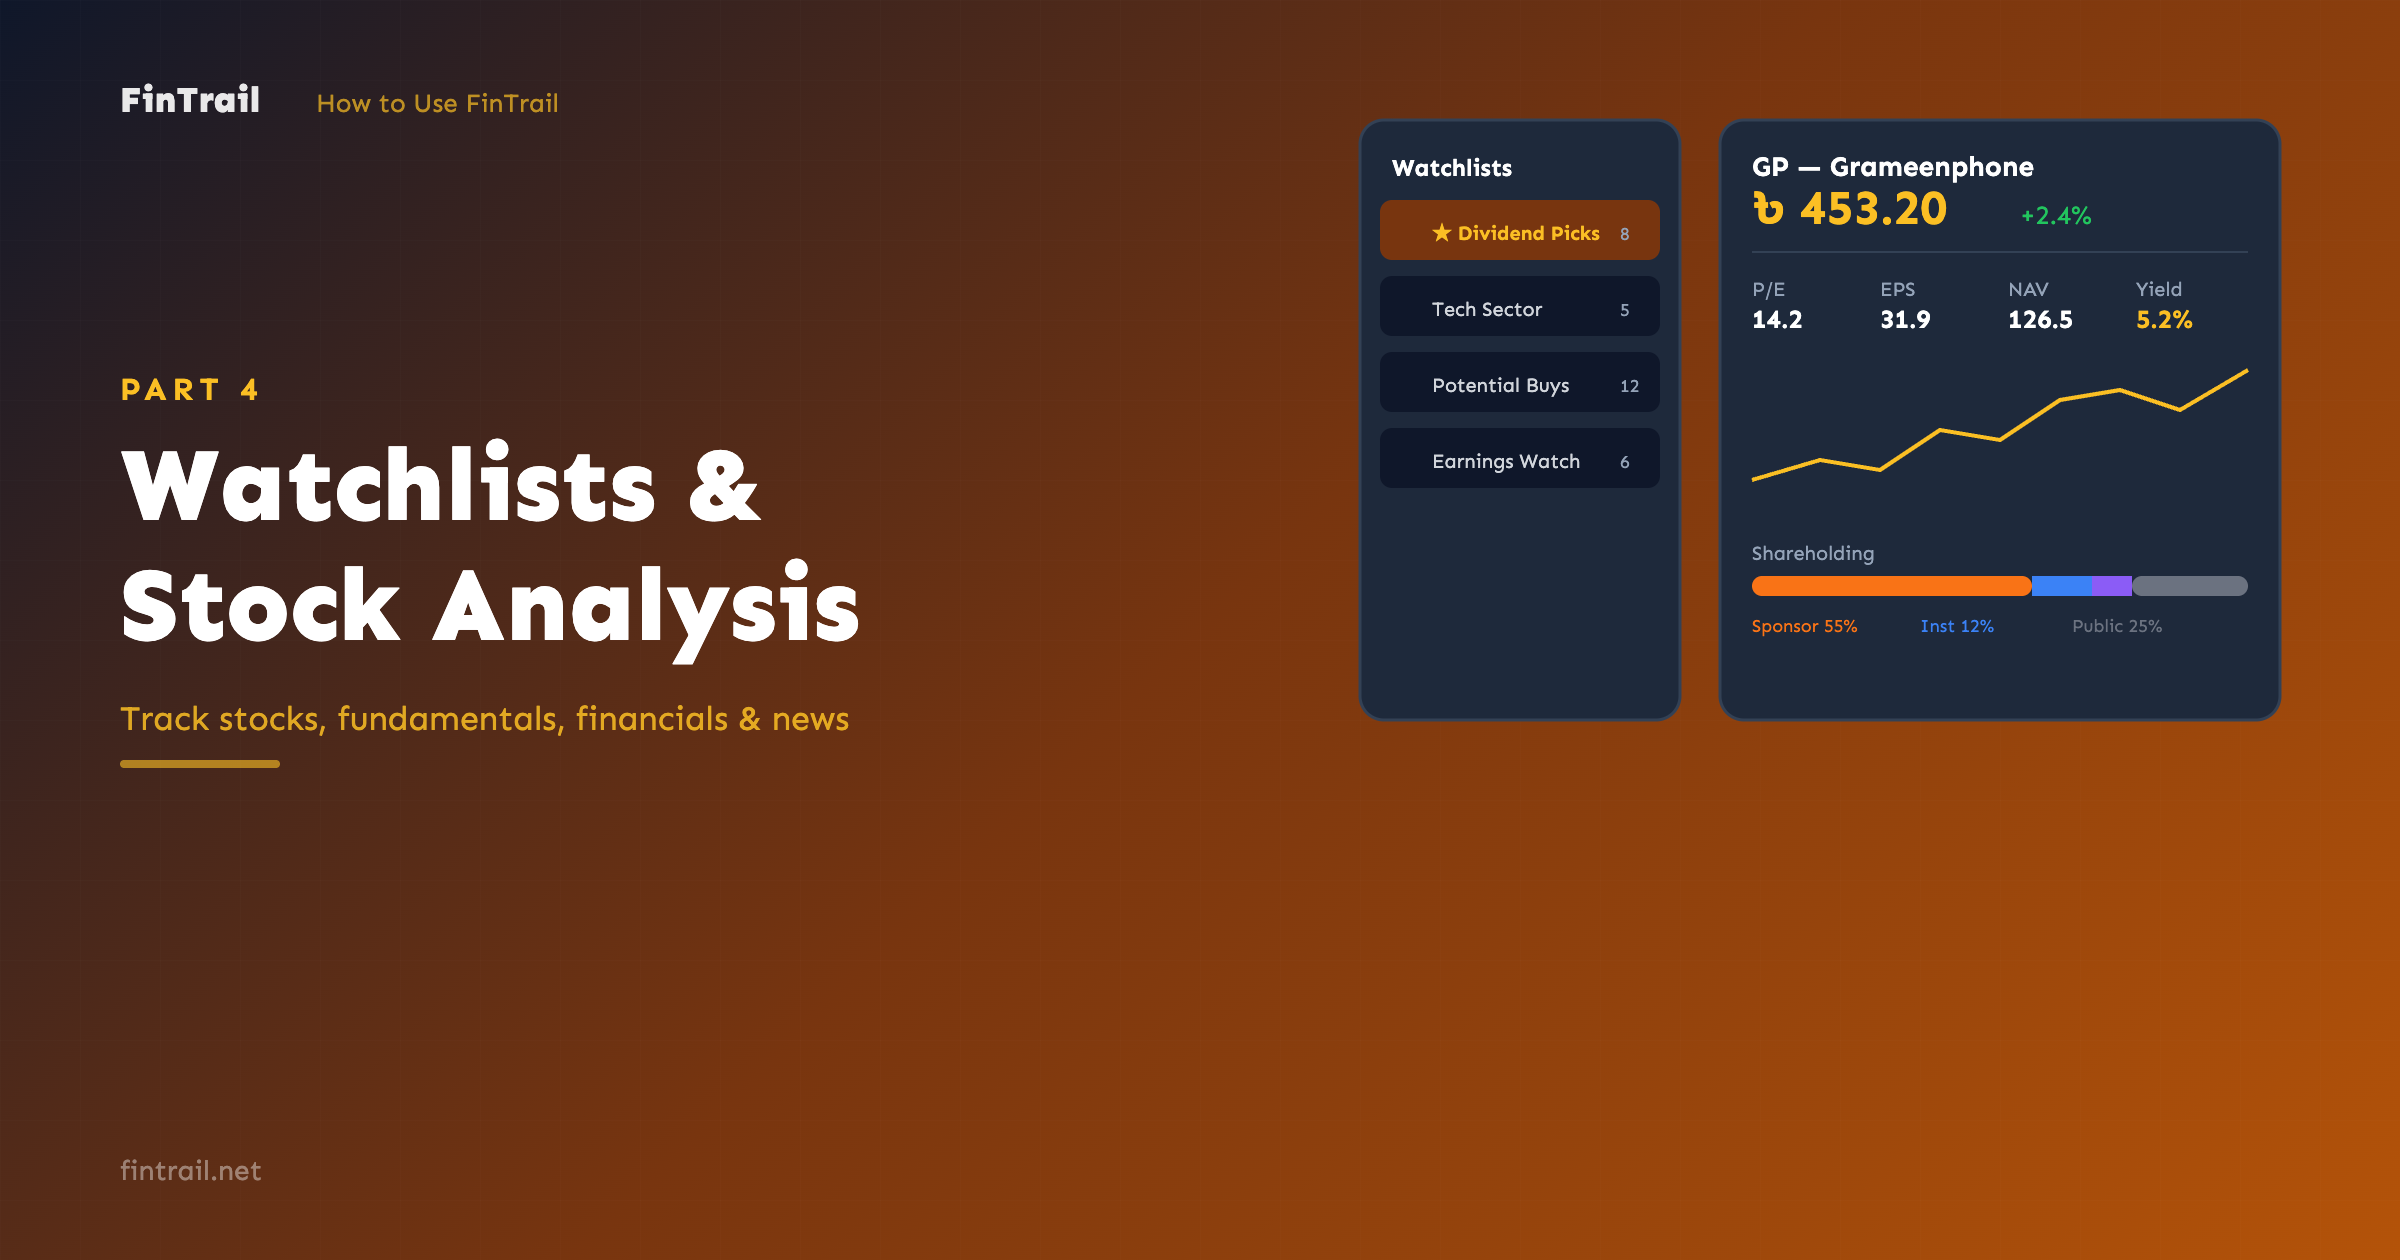
This is Part 5 of the How to Use FinTrail series. ← Previous: Watchlists & Stock Analysis. Continue to Part 6: Stock Screener.