Beyond buying and selling stocks, managing your portfolio means keeping track of cash flow — how much you have deposited, withdrawn, and what is left to invest. FinTrail’s Portfolio Details page handles all of this, while the Trade History page gives you a complete record of every closed trade with detailed stats and CSV export.
Managing Funds
Every portfolio has its own cash balance. You set an initial deposit when creating the portfolio, and from there you can add or remove funds as needed.
Depositing Funds
To add cash to a portfolio:
- Go to Portfolio Details — click the details icon next to any portfolio on the Manage Portfolios page, or navigate directly from the dashboard.
- Enter the amount you want to deposit.
- Optionally add a note (e.g., “Monthly contribution” or “Bonus allocation”).
- Click Deposit.
The deposit shows up immediately in your available funds and transaction timeline.
Withdrawing Funds
Withdrawals work the same way, with one safety check — you cannot withdraw more than your available cash. If you try, FinTrail will show your current available balance and block the transaction.
Available funds are calculated as:
Available Funds = Initial Deposit + Deposits - Withdrawals - Current Investment + Sale ProceedsThis means money from closed trades flows back into your available funds automatically. You do not need to manually “return” cash after selling a stock.
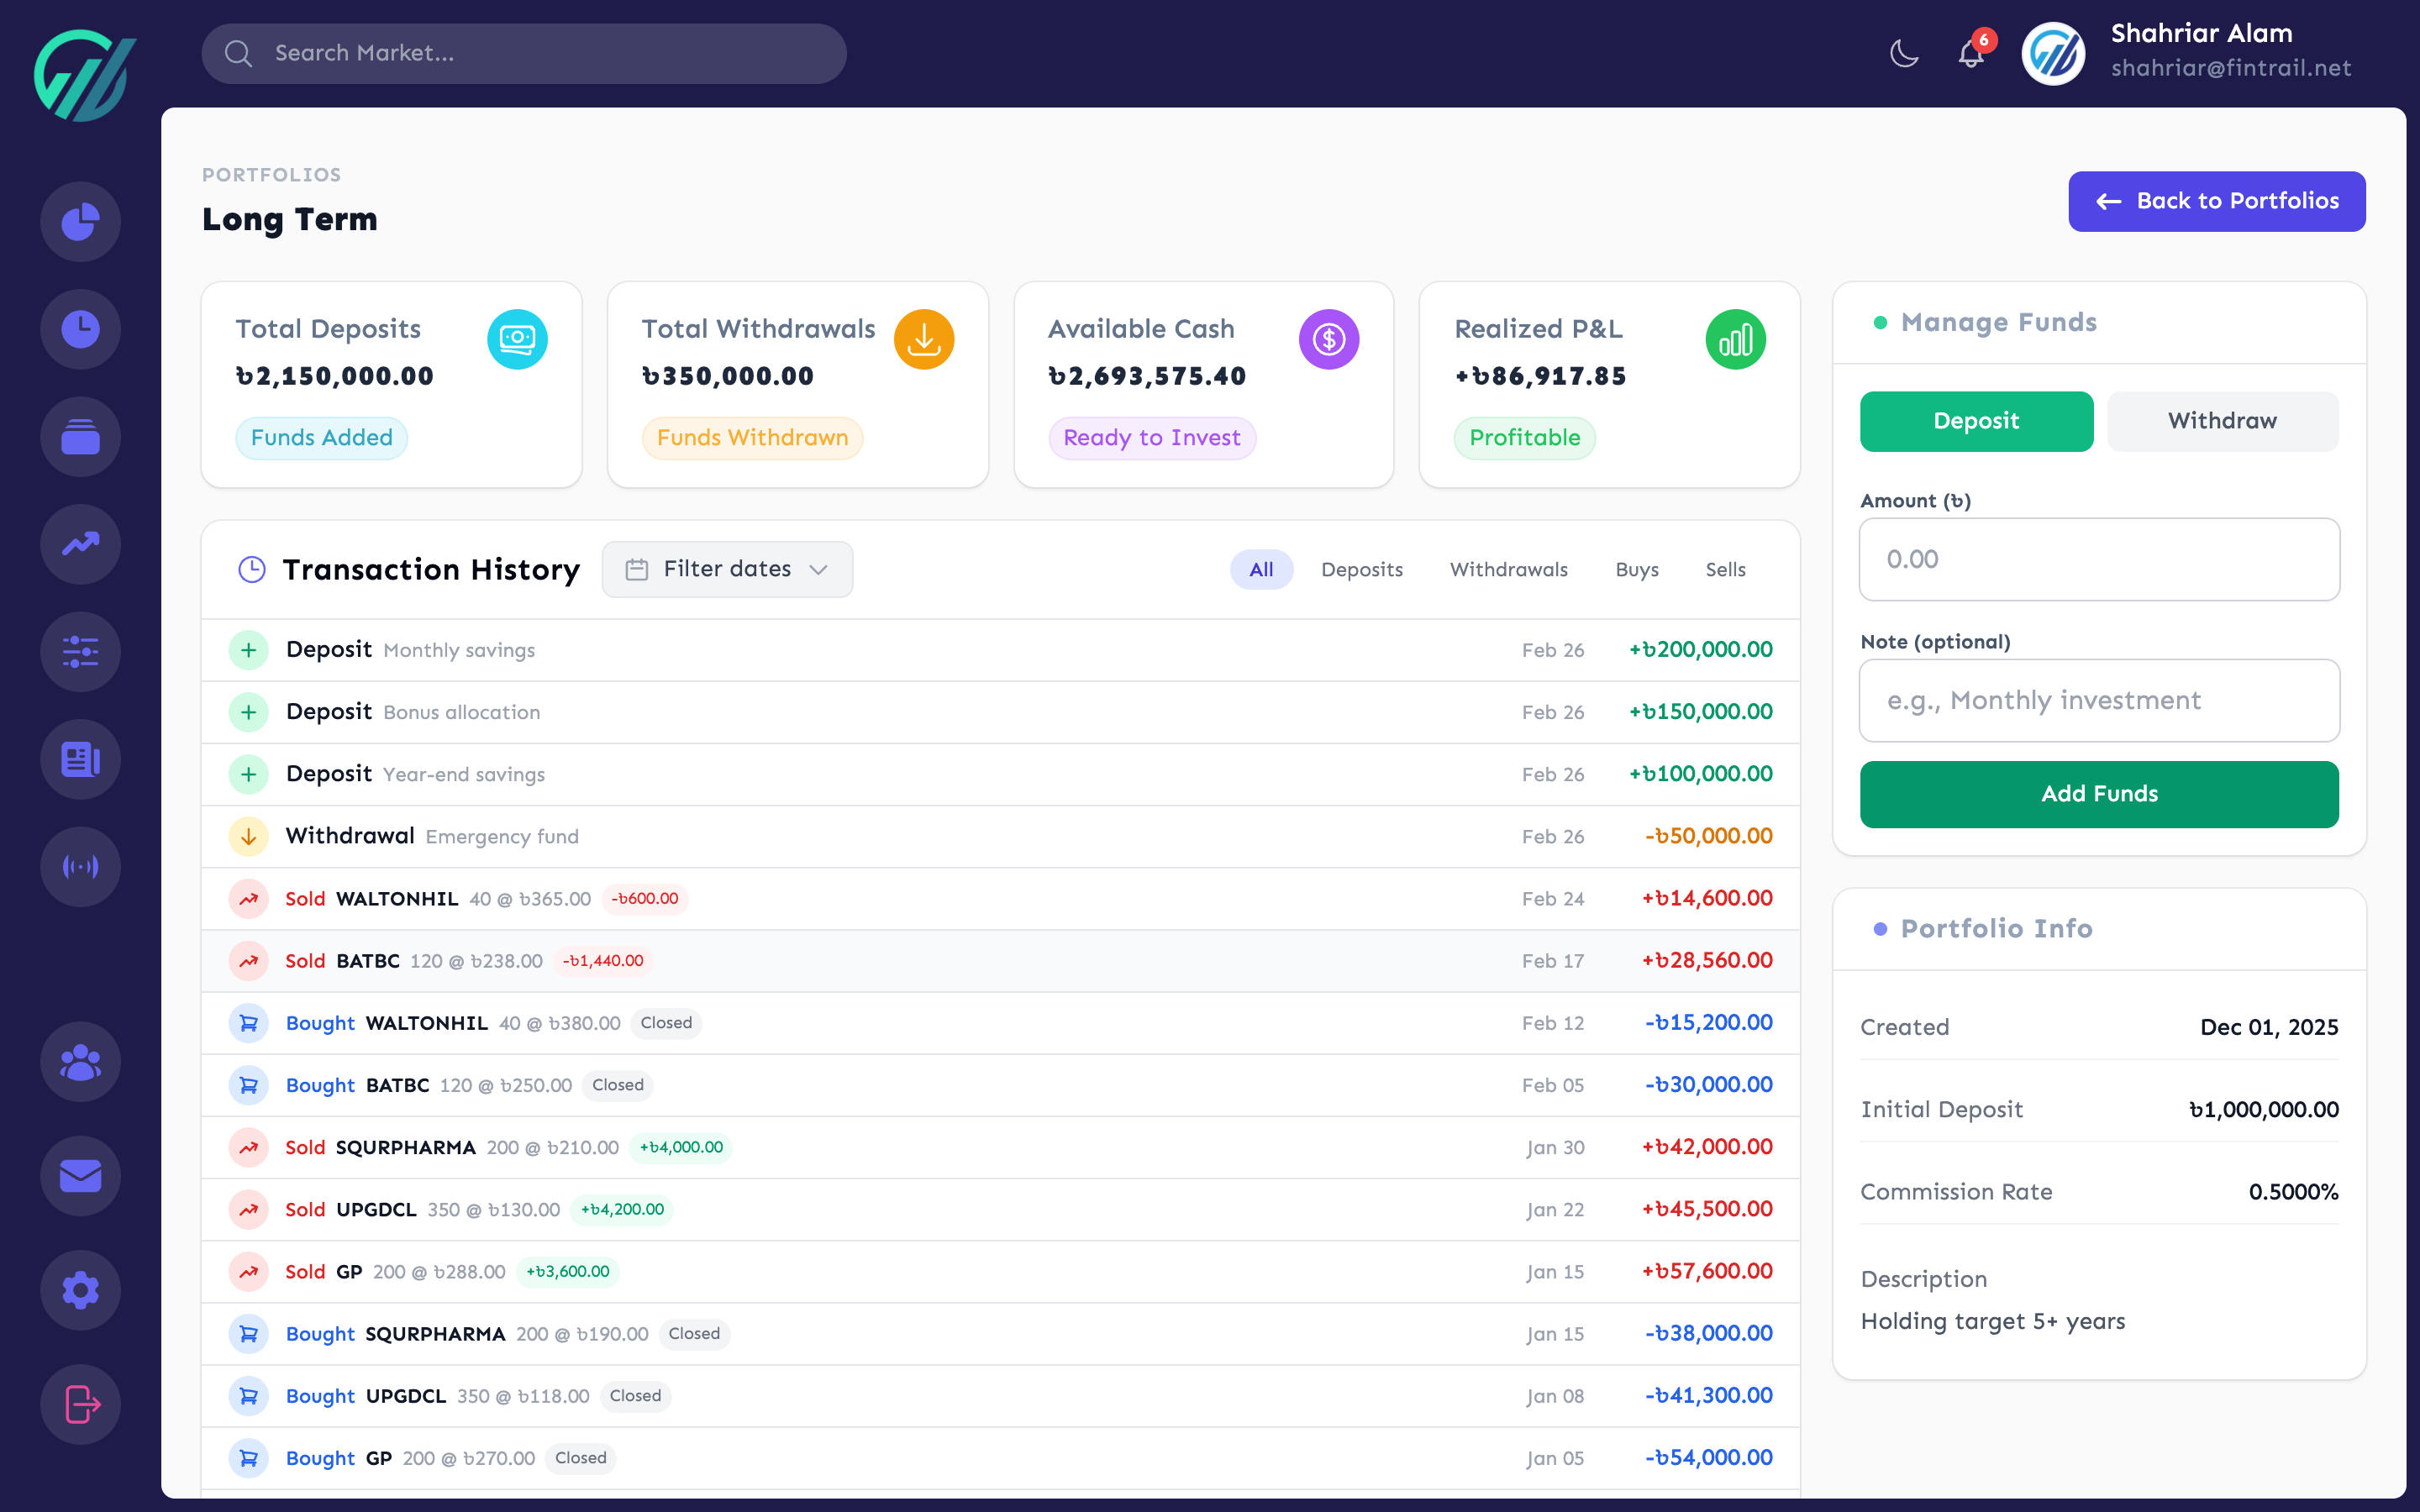
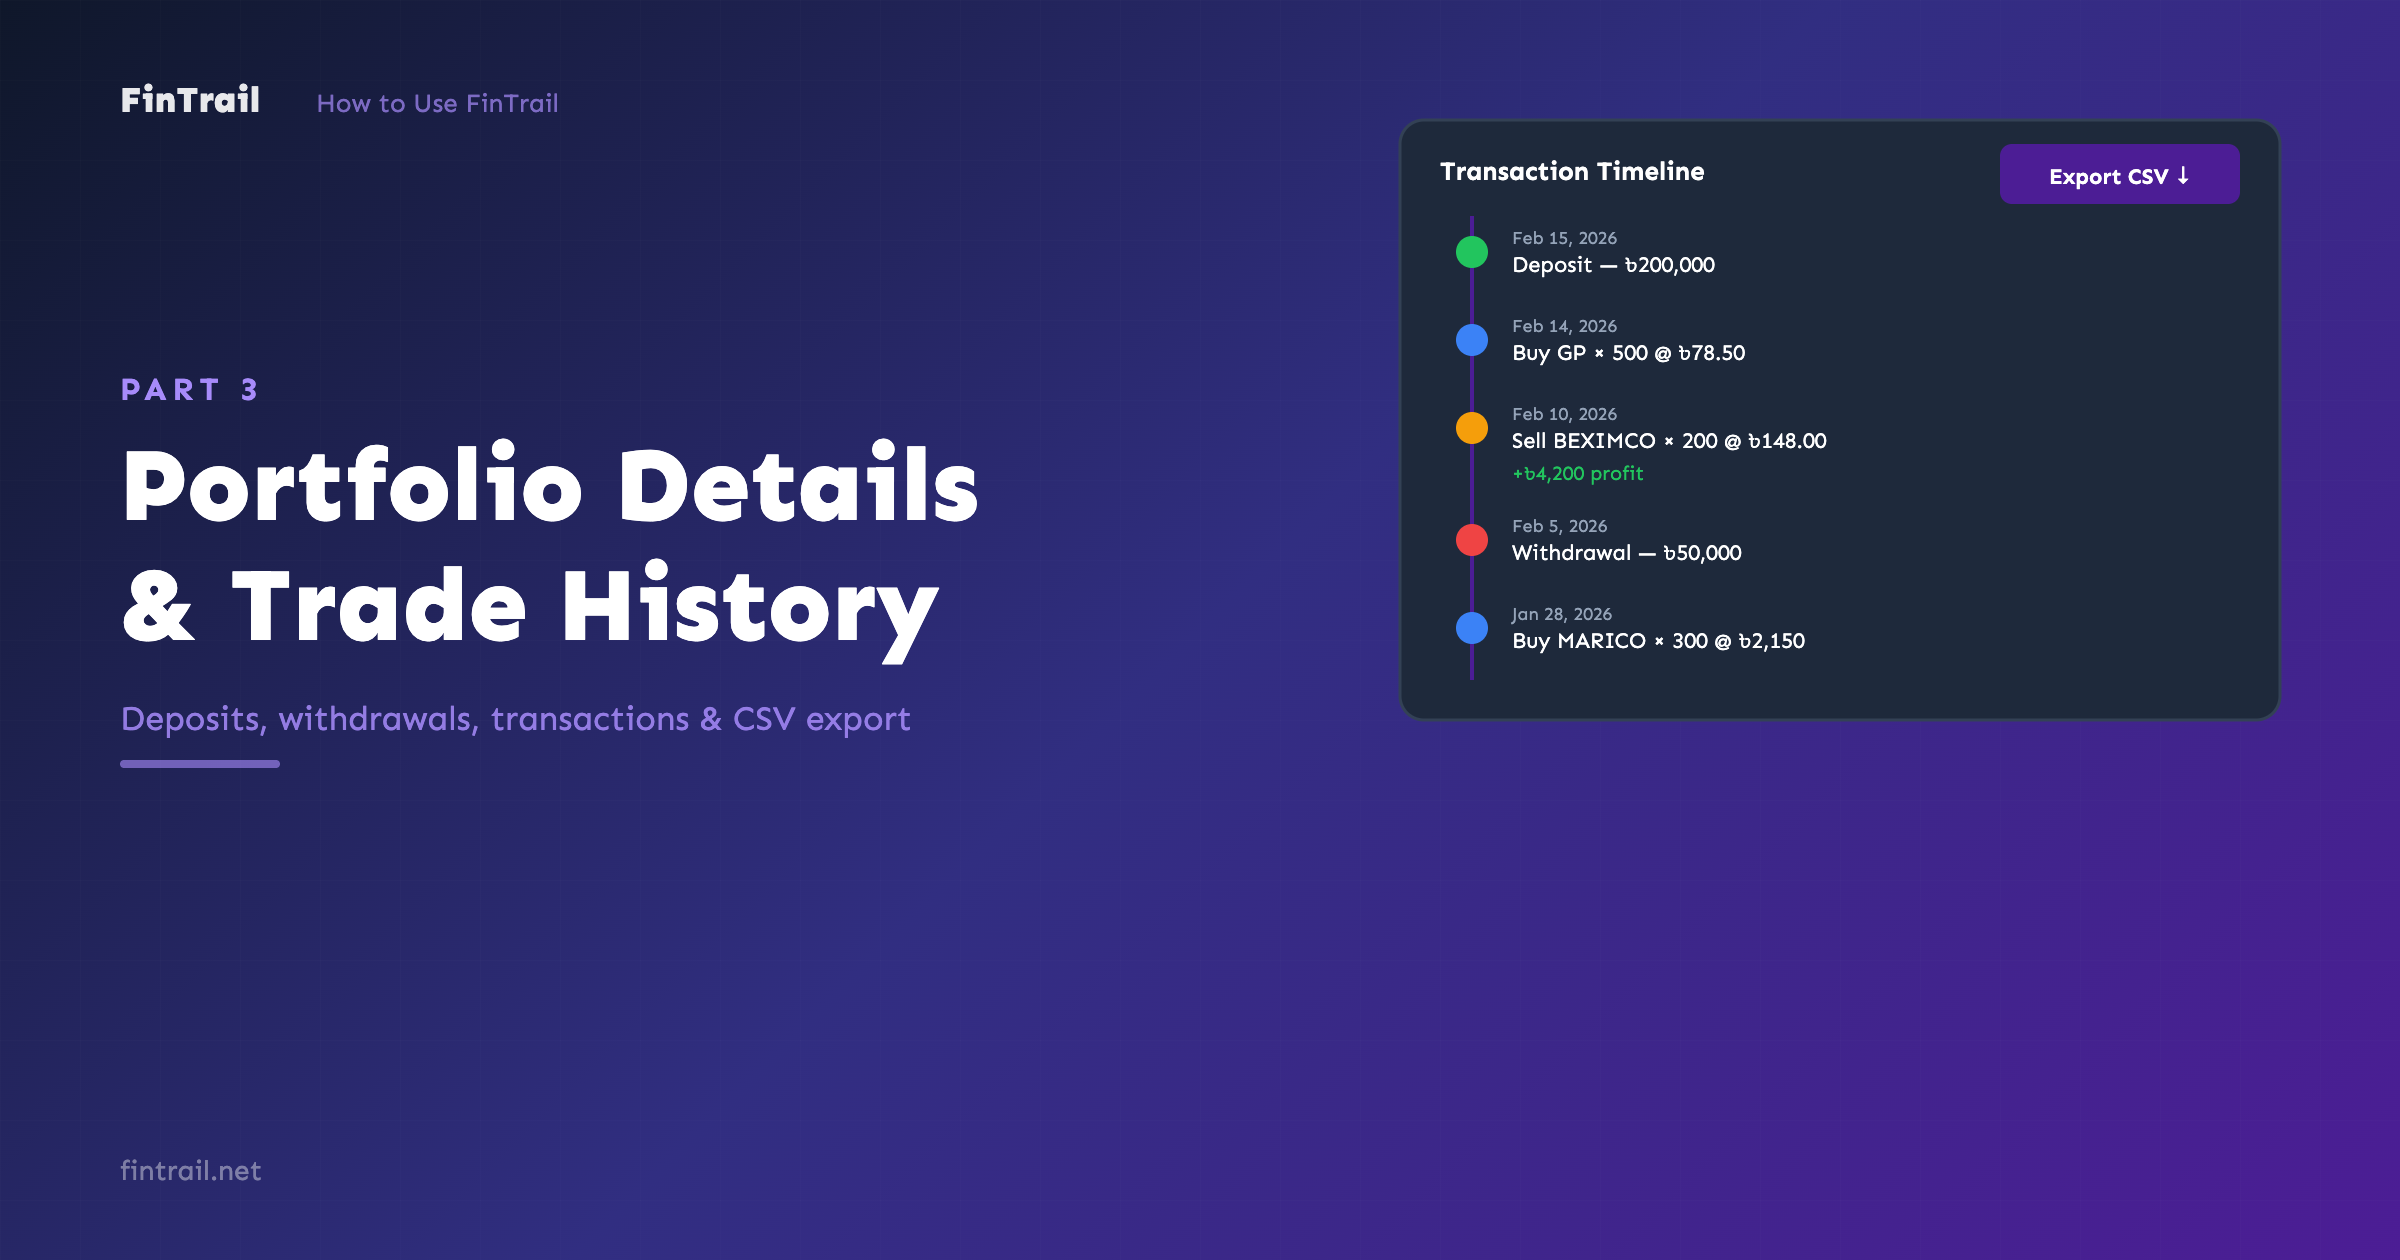
Transaction Timeline
The Portfolio Details page shows a unified timeline of every financial event in your portfolio, sorted by date (newest first). Each entry is color-coded by type:
- Deposits — cash added to the portfolio (including the initial deposit)
- Withdrawals — cash removed from the portfolio
- Buys — stock purchases, showing the stock symbol, quantity, and price per share
- Sells — stock sales, showing the stock symbol, quantity, sale price, and P&L for that trade
This timeline gives you a complete audit trail. You can see exactly when you added funds, bought shares, sold them, and what your realized profit or loss was on each sale.
The page also shows four summary figures at the top:
- Total Deposits — initial deposit plus all additional deposits
- Total Withdrawals — sum of all cash removed
- Available Funds — cash currently available for new trades
- Realized P&L — total profit or loss from all closed trades in this portfolio
Trade History
The Trade History page is where you review all your closed trades across portfolios. It is accessible from the navigation menu and provides two viewing modes, powerful filters, summary statistics, and CSV export.
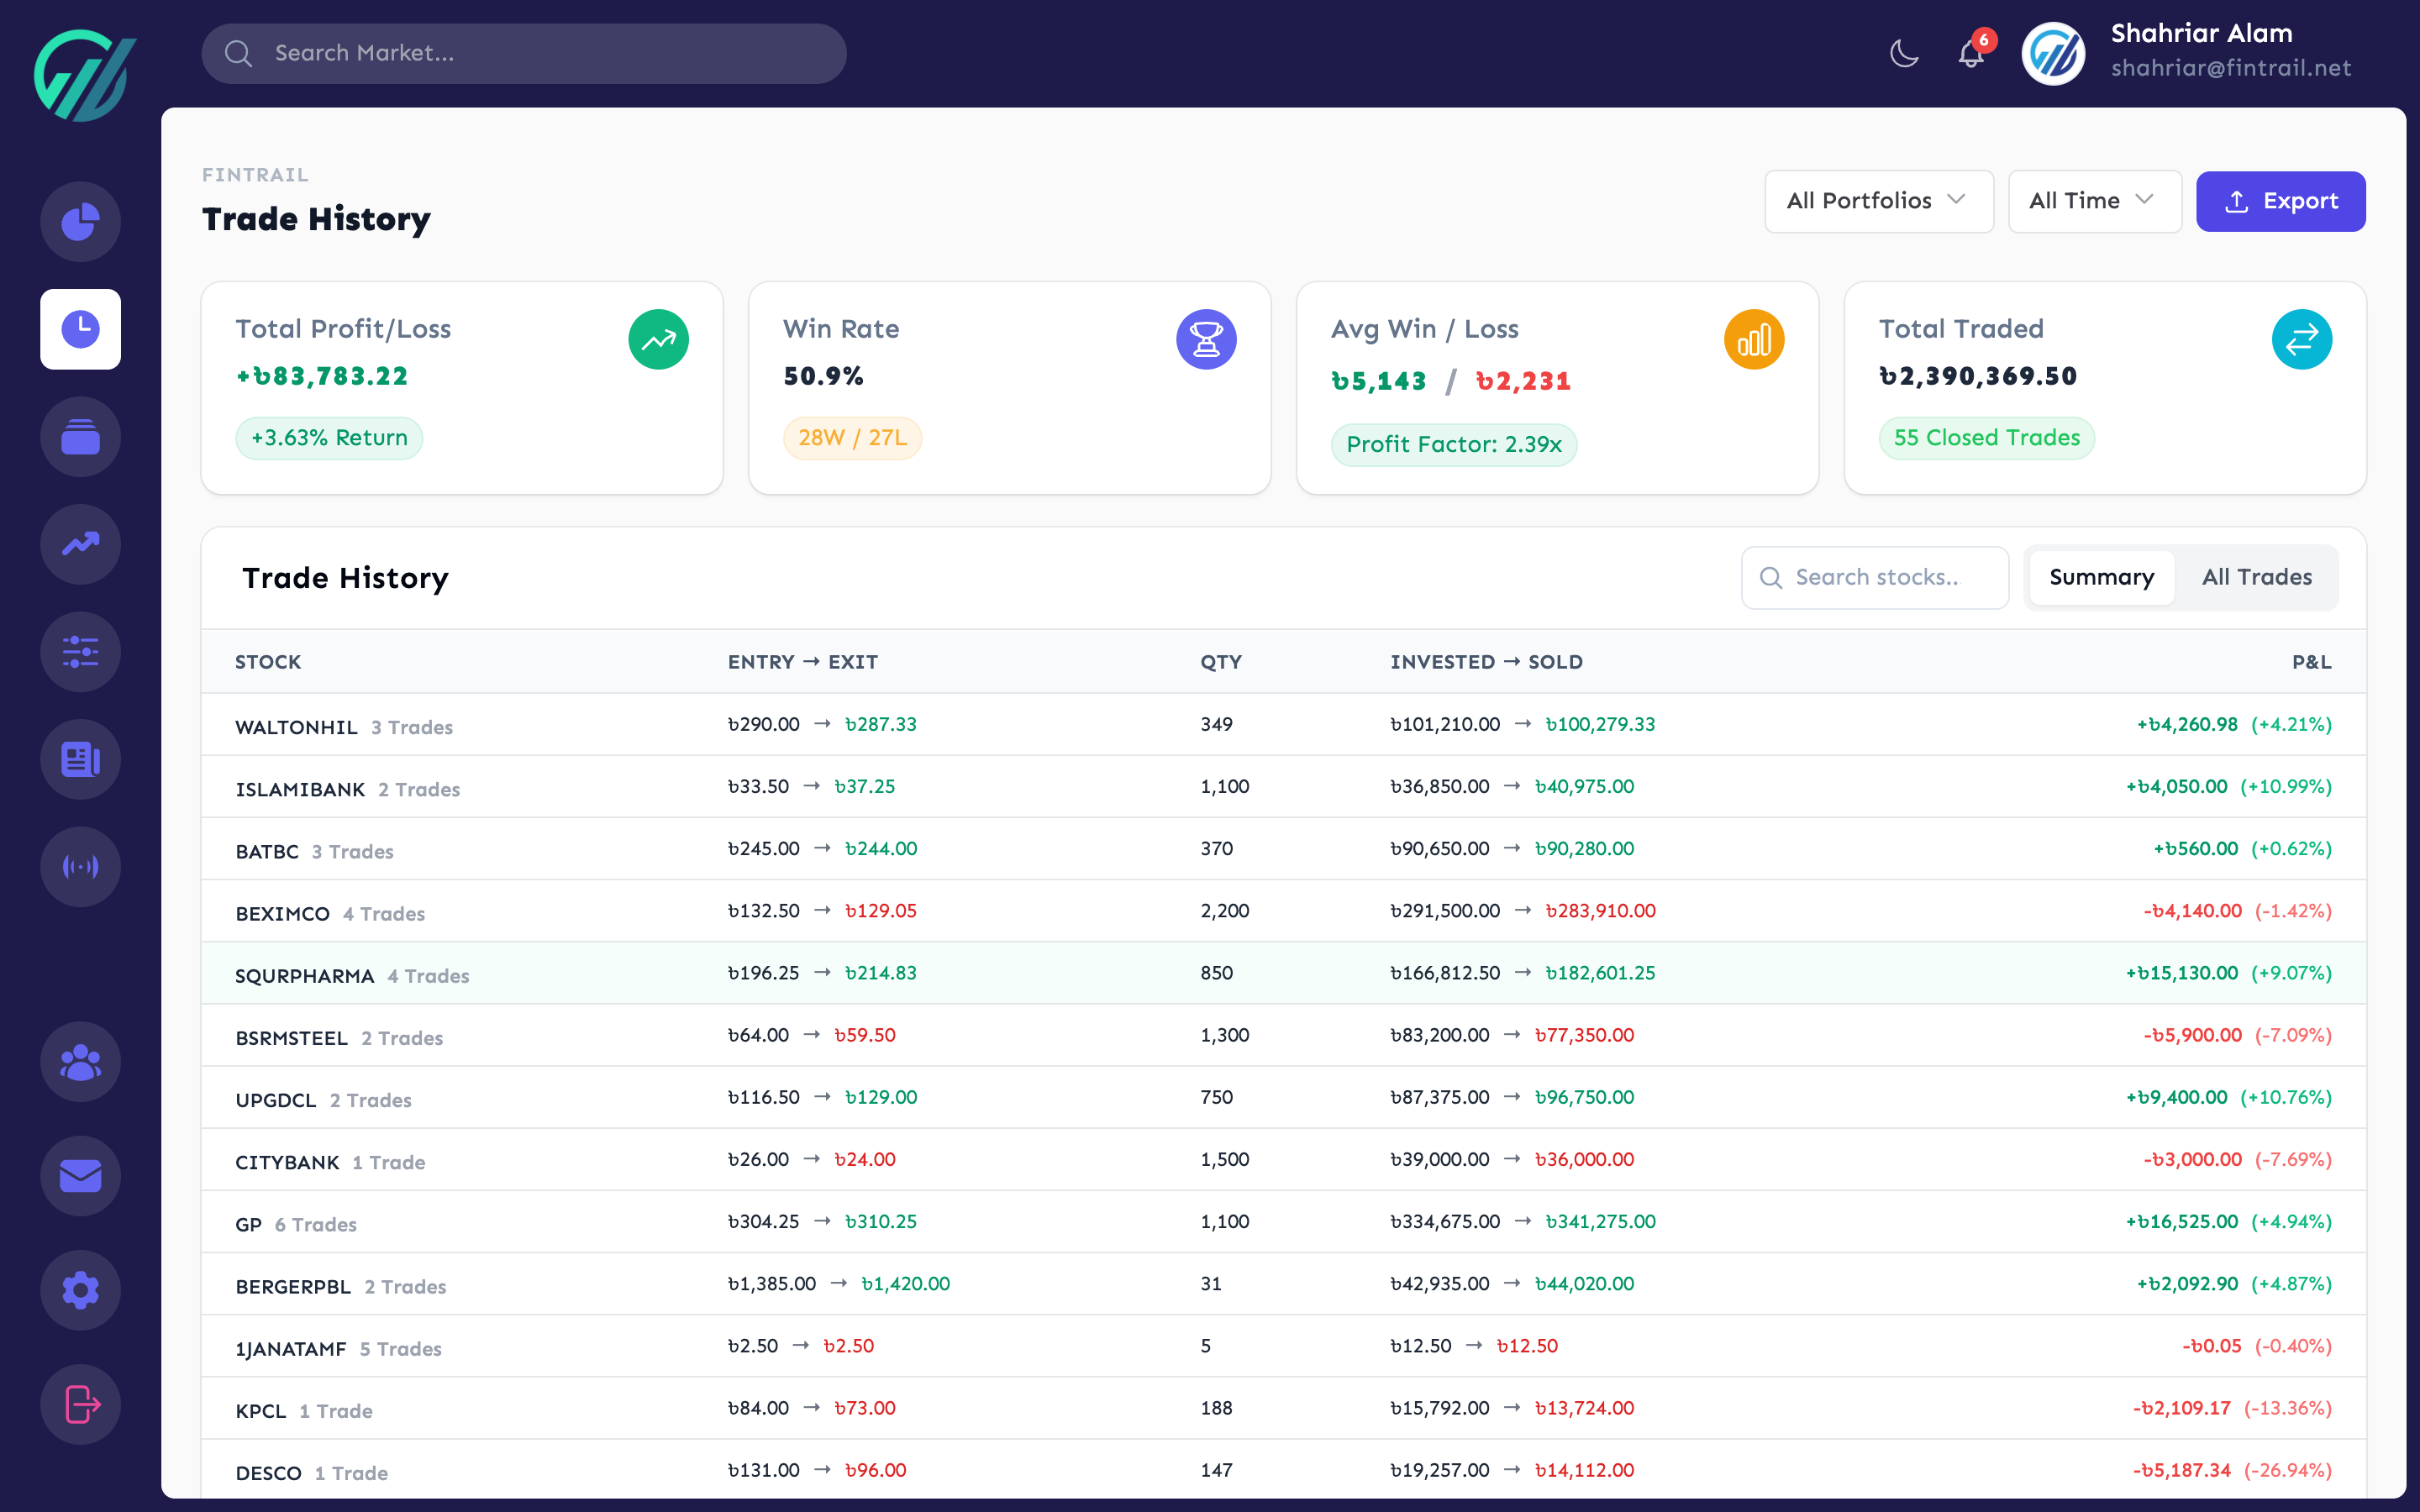
Summary View
By default, Trade History shows a summary view — trades are grouped by stock symbol. For each stock, you see:
- Average entry and exit price
- Total quantity traded
- Number of individual trades
- Total P&L for that stock
Click any stock in the summary to drill down into its individual trades.
Individual Trades View
Switch to the individual view to see every closed trade separately. Each row shows:
- Stock symbol and company name
- Entry price and sale price
- Quantity sold
- P&L amount
- Date the trade was closed
You can sort by date, stock symbol, or profit — ascending or descending.
Filters
Three filters help you narrow down what you are looking at:
- Stock search — type a stock symbol or company name to filter results
- Portfolio — show trades from a specific portfolio or all portfolios
- Time period — filter by This Month, Last 3 Months, This Year, Last Year, or All Time
Filters work together. For example, you can view all BEXIMCO trades from the last 3 months in your “Long Term Holdings” portfolio.
Stats Panel
At the top of the page, a stats panel updates based on your current filters:
- Total Trades — number of closed trades matching your filters
- Total Invested — sum of entry prices multiplied by quantities
- Total Sold — sum of sale prices multiplied by quantities
- Total P&L — net profit or loss
- Win Rate — percentage of profitable trades
- Average Win — mean profit on winning trades
- Average Loss — mean loss on losing trades
- Profit Factor — ratio of total wins to total losses (above 1.0 means you are net profitable)
These stats give you a precise measure of your trading performance for any combination of stocks, portfolios, and time periods.
CSV Export
Click the export button to download your trade history as a CSV file. The export respects all active filters — so if you are viewing only trades from a specific portfolio and time period, the CSV will contain just those trades.
The CSV includes: Date, Company, Quantity, Entry Price, Sale Price, Invested Amount, Sold Amount, P&L, and Return Percentage.
The filename reflects your active filters for easy identification (e.g., trade-history-long-term-holdings-this-year-2026-02-26.csv).
Managing Portfolios
The Manage Portfolios page lets you create, edit, and delete portfolios.
Creating a New Portfolio
Click Create Portfolio and fill in:
- Name — a descriptive name for the portfolio
- Description — a note about its strategy or purpose
- Initial Deposit — starting cash in BDT
- Broker Commission — your brokerage fee as a percentage
Editing a Portfolio
You can update a portfolio’s name, description, and broker commission at any time. The initial deposit cannot be changed after creation — use the deposit/withdraw feature on the Portfolio Details page to adjust funds.
Deleting a Portfolio
Deleting a portfolio permanently removes it along with all its trades, holdings, and transactions. This action cannot be undone, so FinTrail asks for confirmation before proceeding.
What is Next
You now know how to manage your portfolio’s cash flow, read your transaction timeline, and export your trade history. In Part 4, we move beyond your own portfolio and explore how to track stocks with watchlists, set up price alerts from the stocks page, and use FinTrail’s stock analysis tools.
This is Part 3 of the How to Use FinTrail series. ← Previous: Portfolio Management. Continue to Part 4: Watchlists & Stock Analysis.