Your portfolio is the heart of FinTrail. It is where you record every trade, track your performance, and see how your investments are doing in real time. This guide covers everything you need to know about managing your portfolio — from buying your first stock to reading your P&L metrics.
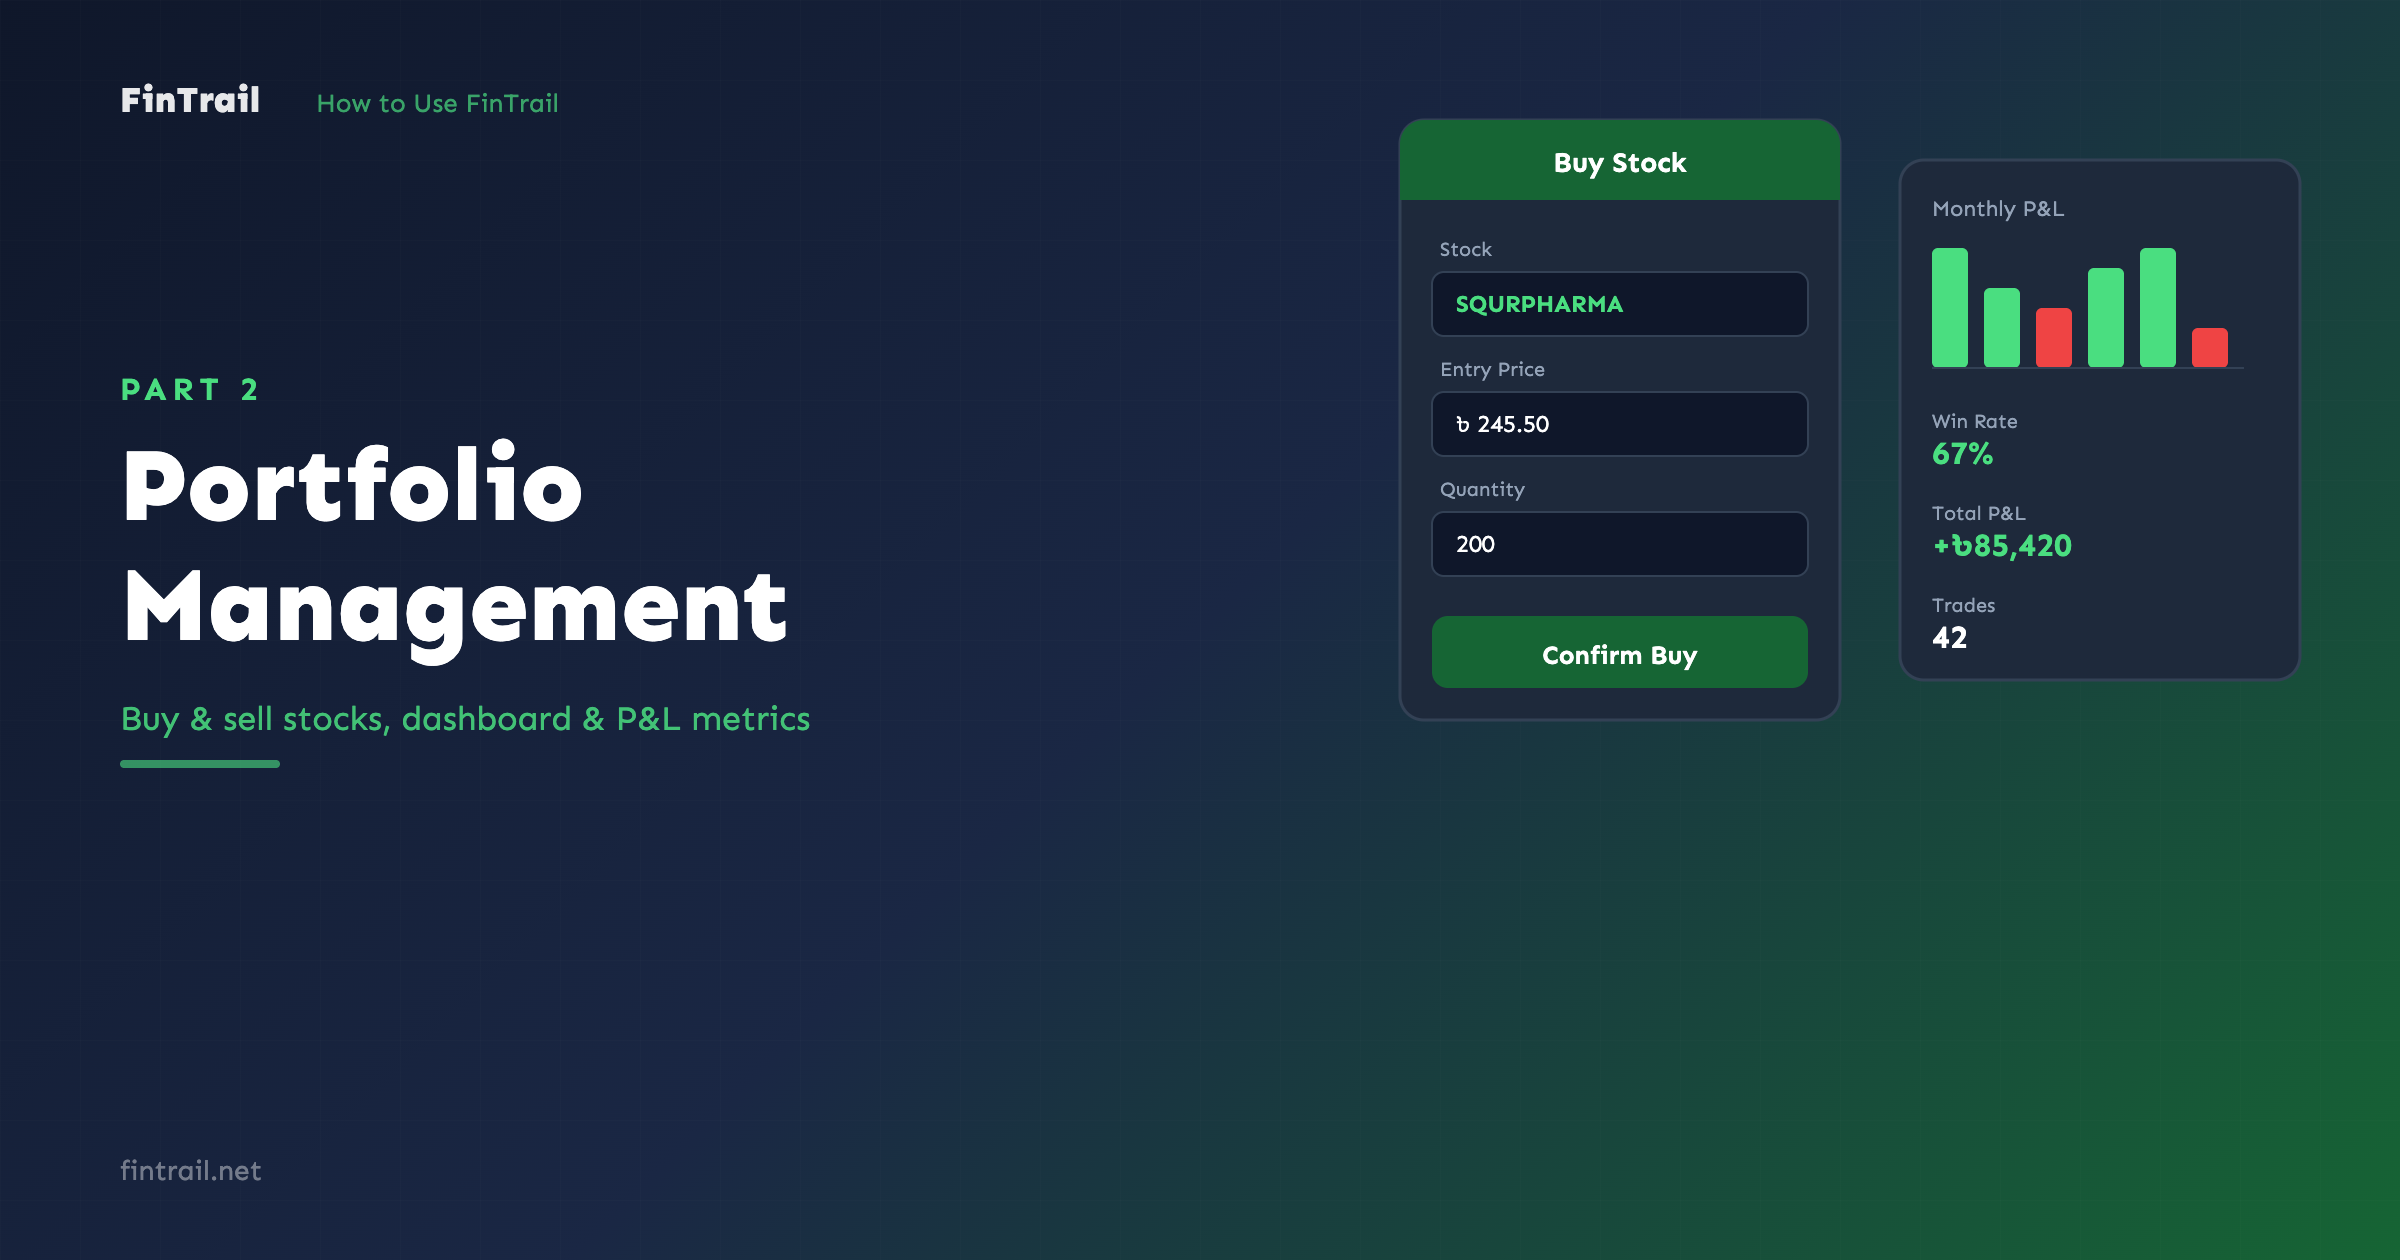
Buying Stocks
To buy a stock, you need to have an active portfolio selected (not “All Portfolios”). Here is how:
- From the portfolio dashboard, make sure a specific portfolio is selected in the dropdown — for example, “Long Term Holdings”.
- Click Select a portfolio to buy or the buy button in the holdings section.
- In the buy form:
- Stock — type the stock symbol (e.g., GP, BEXIMCO, SQURPHARMA) and select from the autocomplete
- Entry price — the price per share you paid
- Quantity — how many shares you bought
FinTrail automatically calculates:
- Stock cost — quantity multiplied by entry price
- Broker fee — based on your portfolio’s commission percentage
- Total cost — stock cost plus broker fee
- Available funds — how much cash remains in the portfolio after this trade
If the total cost exceeds your available funds, FinTrail will warn you. You can add more funds from the Portfolio Details page.

Selling Stocks
When you sell, FinTrail tracks the profit or loss for each trade. Here is the process:
- Find the stock you want to sell in the All Trades view
- Click the sell button next to the specific trade
- Enter:
- Quantity — how many shares to sell (can be partial)
- Sale price — the price per share you sold at
- Date — when the sale happened (defaults to today)
FinTrail handles two types of sells:
- Full sell — selling all shares of a trade closes it completely. The trade moves to your Trade History with a calculated P&L.
- Partial sell — selling some shares creates a new closed trade for the sold portion while keeping the remaining shares as an open trade.
Broker commission is deducted from the sale proceeds. The P&L calculation is:
P&L = (Sale Price × Quantity - Commission) - (Entry Price × Quantity)Understanding the Dashboard
The portfolio dashboard packs a lot of information into one screen. Here is what each section tells you.
Summary Cards
At the top of the dashboard, four cards give you the big picture:
- Available Cash — uninvested funds in the selected portfolio
- Current Holdings — total market value of all open positions, with a count of how many positions you hold
- Unrealized P&L — how much your open positions are up or down compared to what you paid. This changes with market prices.
- Realized P&L — total profit or loss from all closed trades, with a count of completed trades
Monthly P&L Chart
The bar chart shows your realized gains and losses for each of the last 12 months. Green bars are profitable months, red bars are losing months. This gives you a quick visual of your trading consistency.
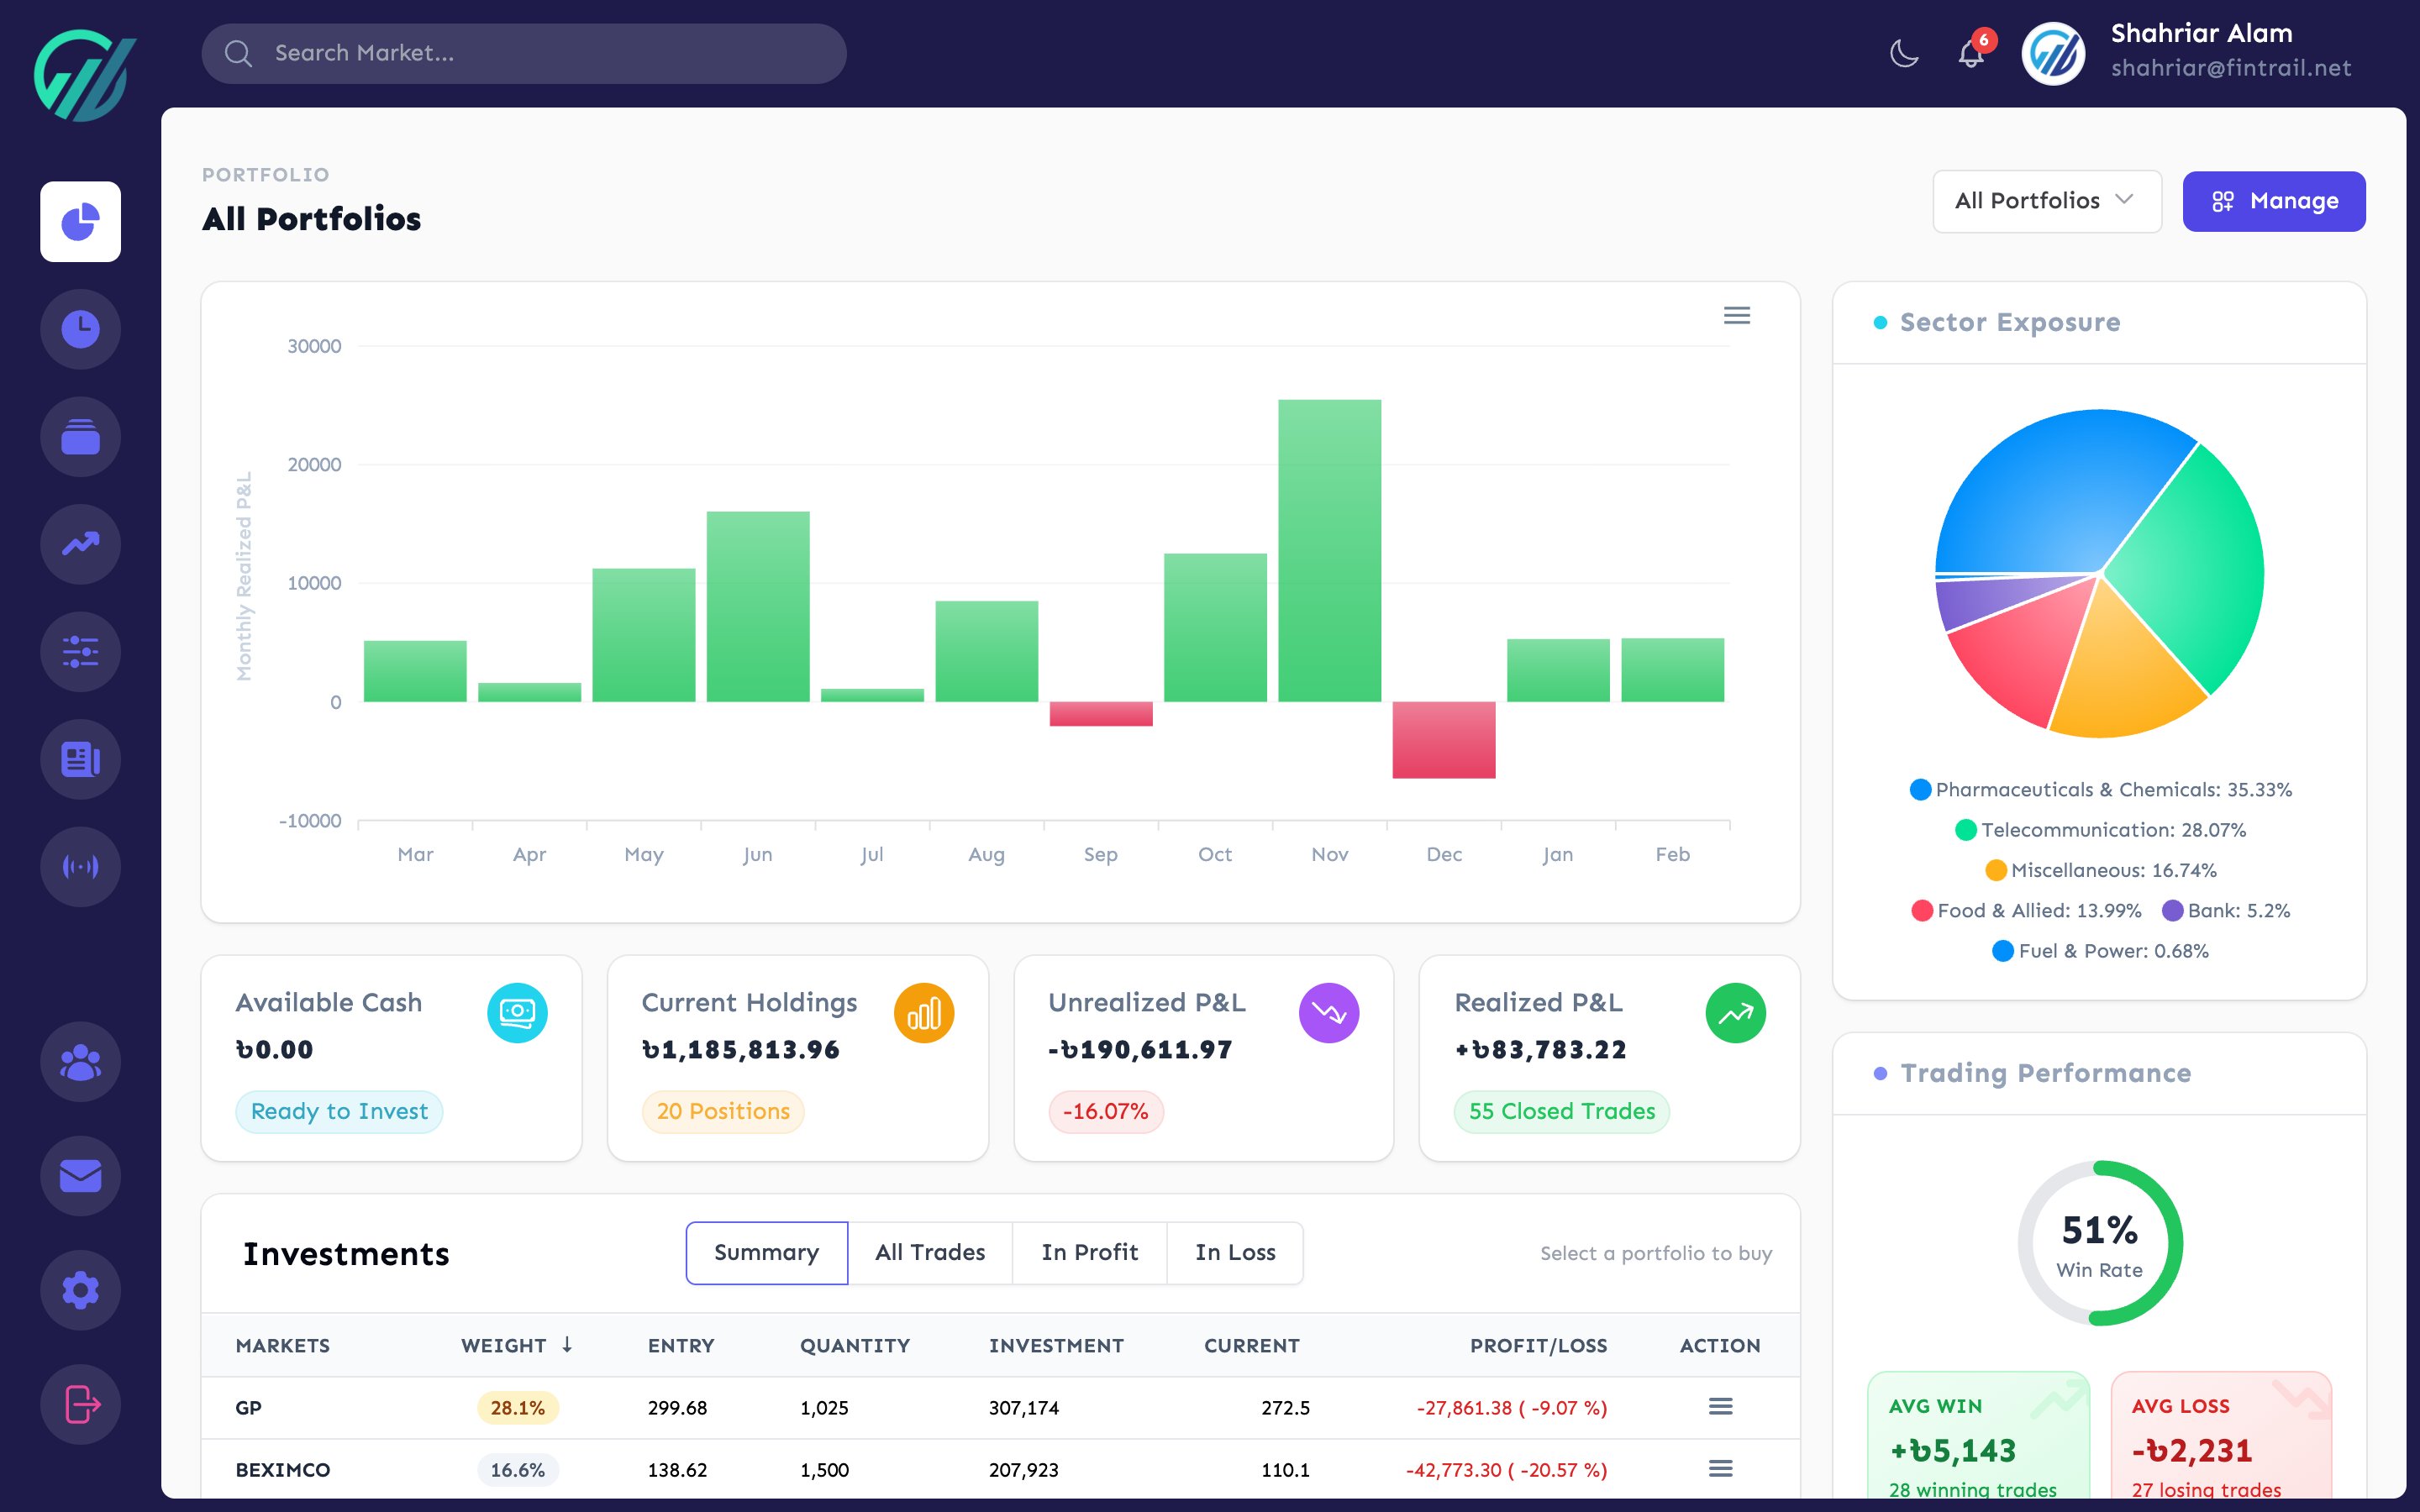
Sector Exposure
The pie chart shows how your current portfolio value is distributed across sectors. This helps you check if you are too concentrated in one sector — for example, if 60% of your money is in pharmaceuticals, you might want to diversify.
Trading Performance
A summary of your trading track record:
- Win Rate — percentage of closed trades that were profitable
- Average Win — mean profit on winning trades
- Average Loss — mean loss on losing trades
A win rate above 50% combined with an average win larger than the average loss is a strong sign.
Best & Worst Performers
Shows your top 5 best-performing and worst-performing open positions by percentage gain/loss. Useful for identifying which stocks are carrying the portfolio and which are dragging it down.
Holdings Views
The investments section offers multiple views of your positions:
- Summary — groups holdings by stock symbol, showing aggregated quantity, average cost, current price, and P&L. Best for a quick overview.
- All Trades — shows individual trade entries with their specific entry price, date, and status. Use this when you want to sell from a specific trade or see your cost basis per lot.
- In Profit — filters to show only positions that are currently green
- In Loss — filters to show only positions that are currently red
Holdings are sortable by weight (percentage of portfolio), and you can toggle between ascending and descending order.
Switching Portfolios
Use the portfolio dropdown at the top of the dashboard to switch between portfolios. Select All Portfolios to see an aggregated view of everything across all your portfolios — your total holdings, total P&L, and combined sector exposure.
When “All Portfolios” is selected, the buy/sell buttons are disabled. You must select a specific portfolio to make trades.
What is Next
Now that you can buy and sell stocks and read your dashboard, the next step is managing your portfolio’s cash flow and reviewing your trade history. In Part 3, we cover deposits, withdrawals, transaction history, and exporting your trade data.
This is Part 2 of the How to Use FinTrail series. ← Previous: Getting Started with FinTrail. Continue to Part 3: Portfolio Details & Trade History.