The Stock Screener is one of FinTrail’s most powerful tools. It lets you filter all ~400 DSE-listed stocks using over 60 criteria spanning price, volume, valuation, fundamentals, shareholding, and technical indicators. Whether you are looking for undervalued dividend stocks or momentum plays with high RSI, the screener finds them for you.
How the Screener Works
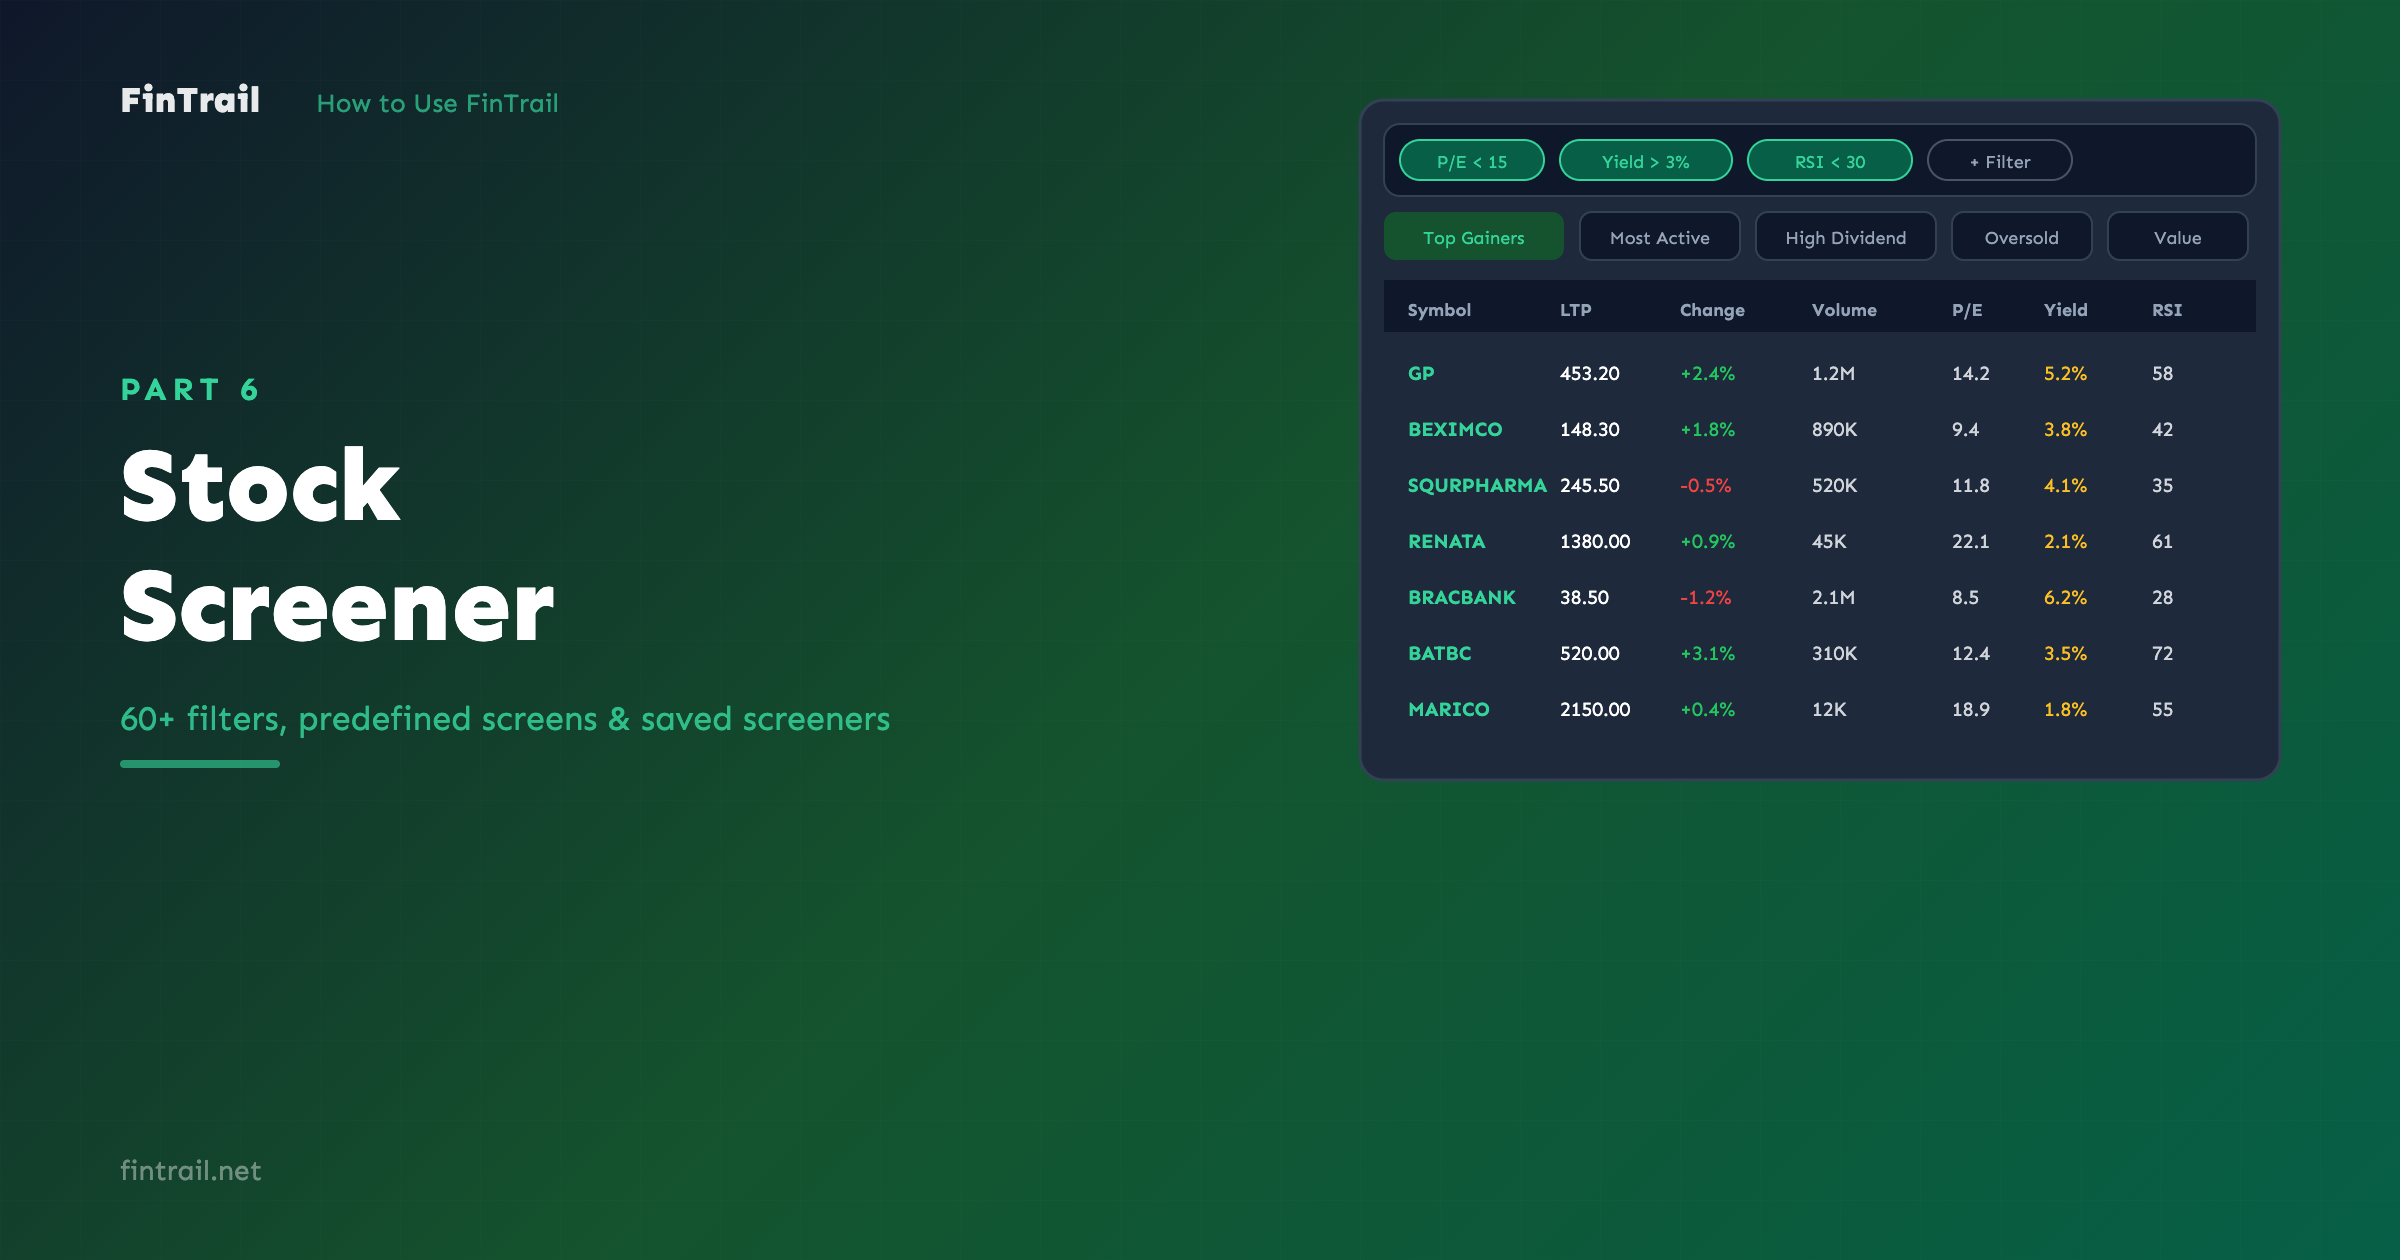
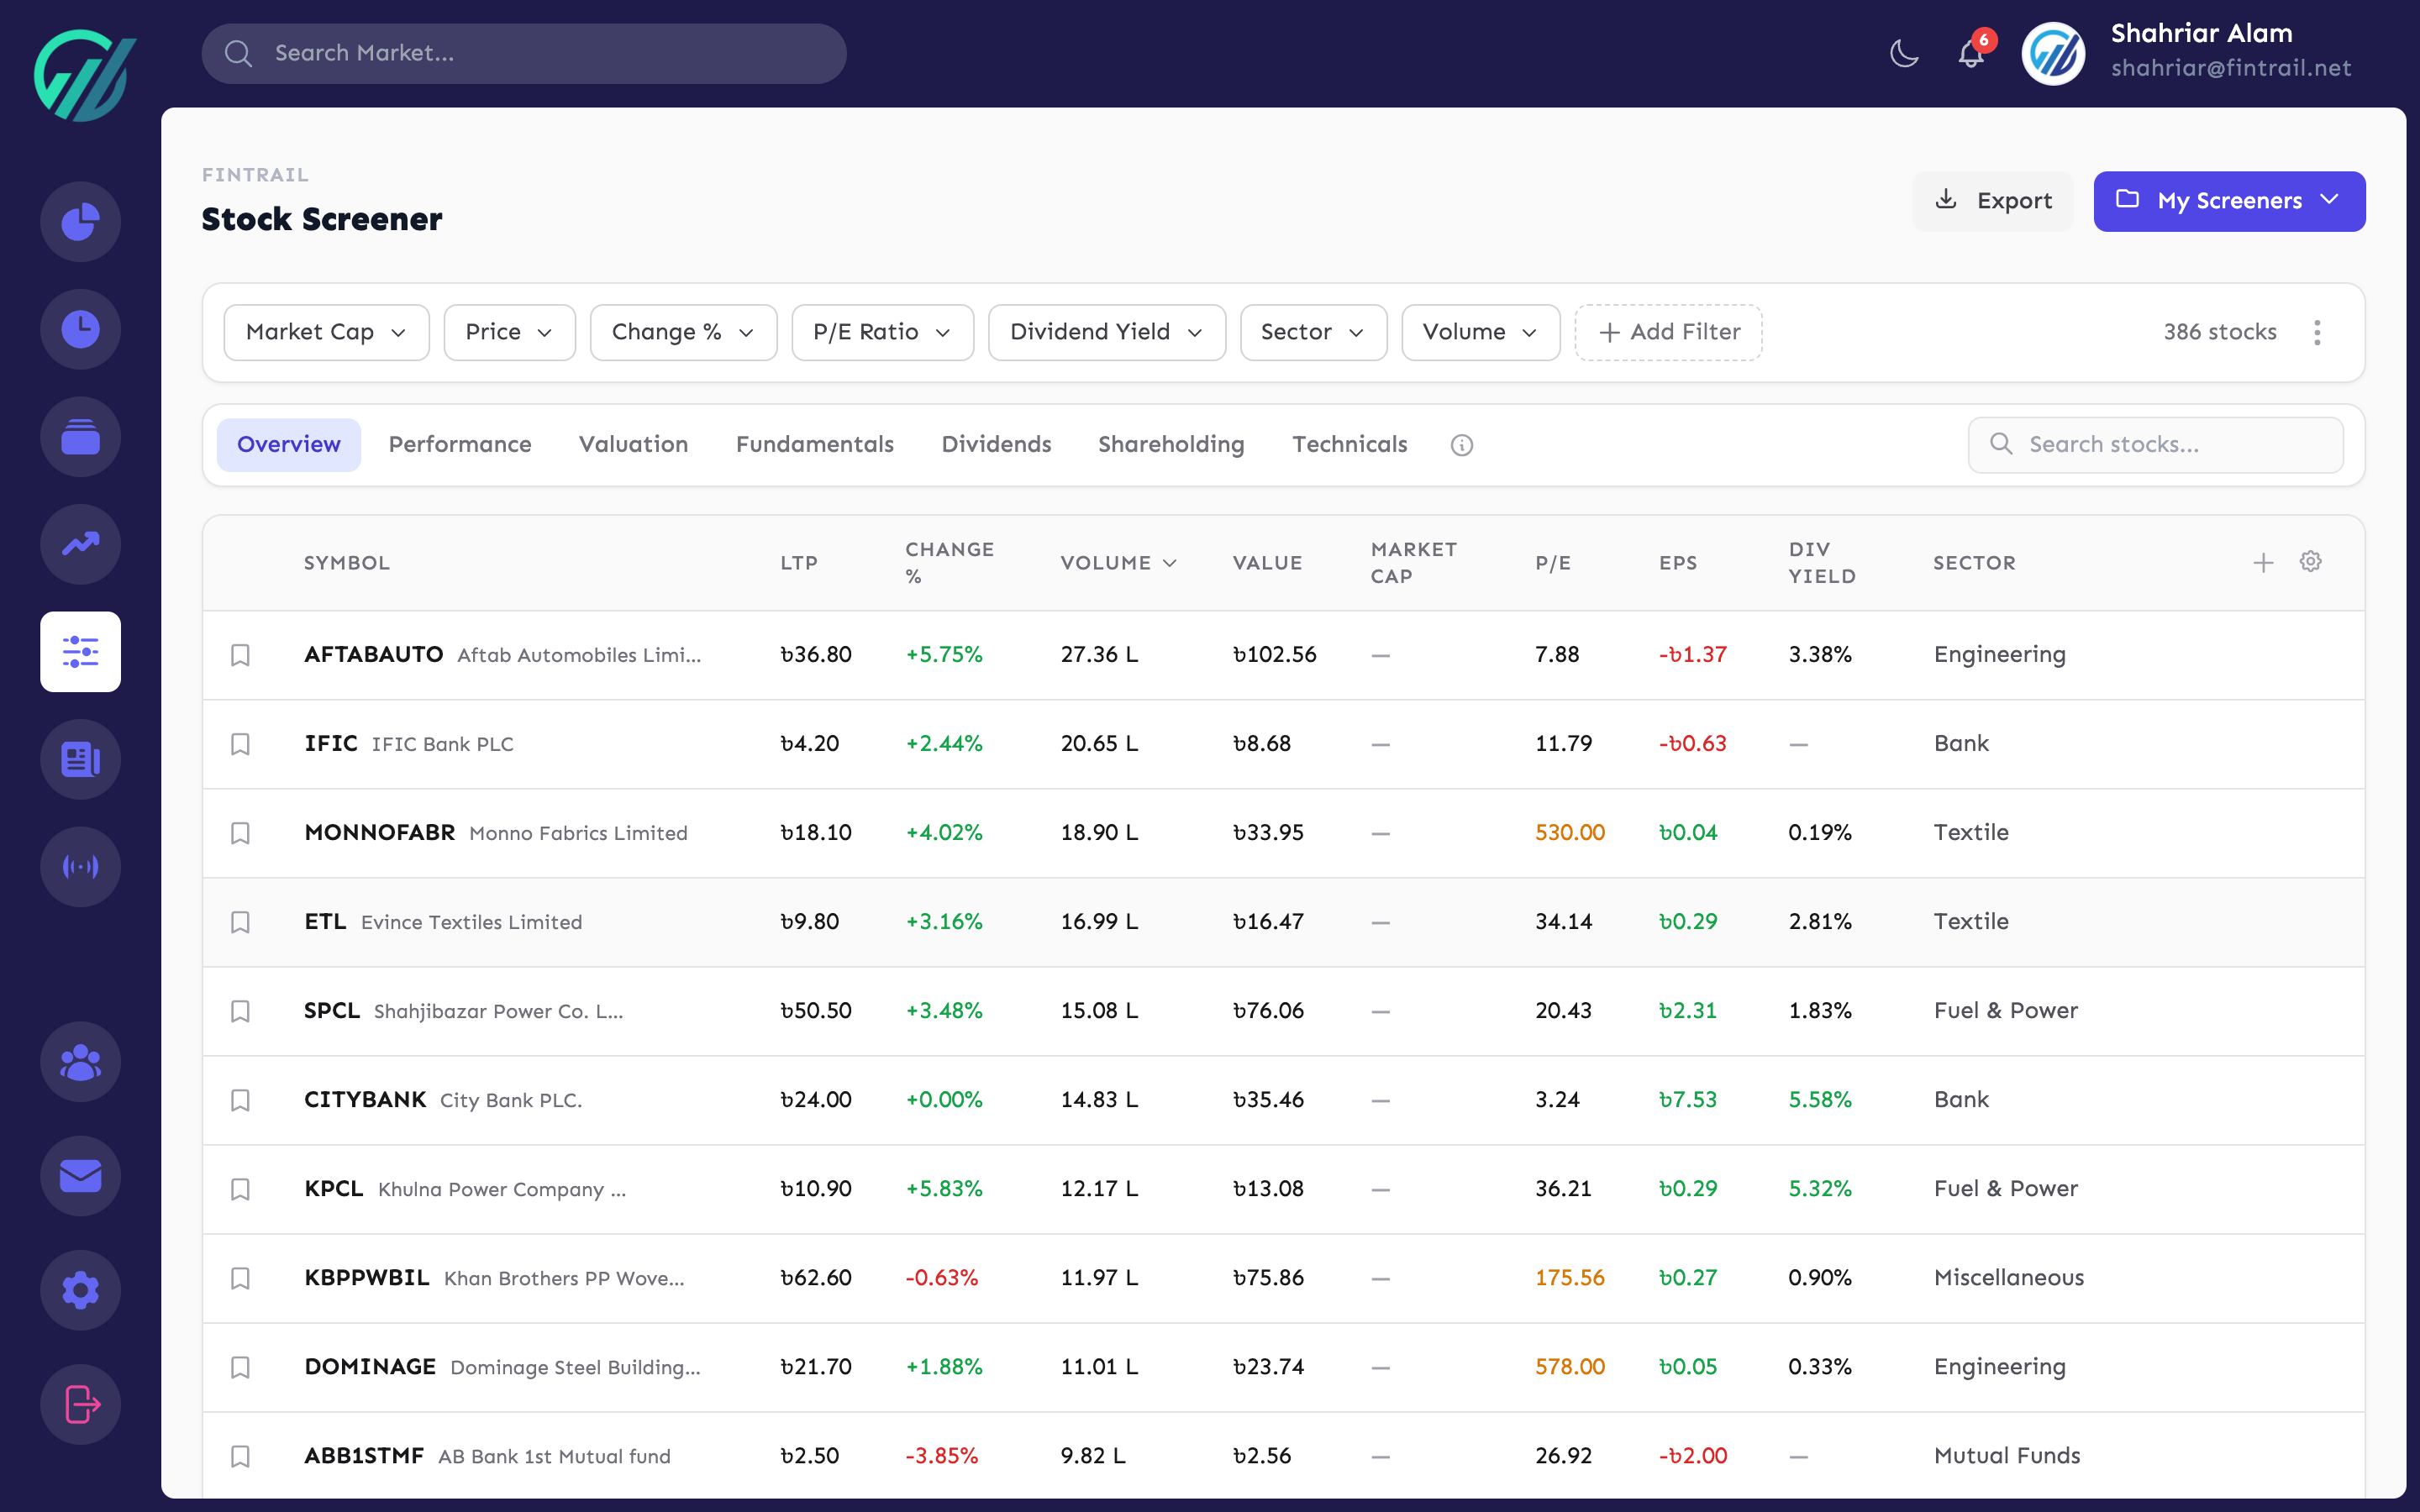
The screener starts by showing all stocks sorted by volume. From there, you add filters to narrow down the list. Results update instantly as you change criteria.
Predefined Screens
FinTrail includes 12 ready-made screens for common strategies. Click any screen to instantly apply its filters:
- Top Gainers — stocks with positive daily change, sorted by highest gain
- Top Losers — stocks with negative daily change, sorted by biggest drop
- Most Active — highest trading volume today
- Top Value — highest trade value (price multiplied by volume)
- Near 52W High — stocks within 5% of their 52-week high
- Near 52W Low — stocks within 5% of their 52-week low
- High Dividend — dividend yield above 3%
- Oversold (RSI < 30) — technically oversold stocks
- Overbought (RSI > 70) — technically overbought stocks
- Value Stocks (Low P/E) — P/E ratio between 0.01 and 15
- High Sponsor Holding — sponsor/director ownership above 50%
- Foreign Interest — foreign ownership above 1%
These screens are a great starting point. You can use them as-is or add additional filters on top.
Adding Custom Filters
Click the filter bar to add your own criteria. Filters are available across seven categories:
Price Filters
- Current price (LTP), daily change percentage, day’s high and low
- Floor price and ceiling price
- 52-week high and low, distance from 52-week extremes
- Performance over time: 1 week, 1 month, 3 months, year-to-date, 1 year
Volume Filters
- Today’s volume, trade value, and trade count
- 20-day average volume
- Relative volume (today’s volume vs. 20-day average)
Valuation Filters
- P/E ratio, Price-to-Book ratio
- Market capitalization
- EPS, NAV, face value
Fundamental Filters
- Quarterly EPS (Q1, Q2, Q3)
- Paid-up capital, authorized capital, reserve and surplus
- Yearly profit, yearly income
- Short-term and long-term loans
- Total shares, market lot, listing year
Dividend Filters
- Dividend percentage and dividend yield
Shareholding Filters
- Sponsor/Director, Government, Institutional, Foreign, and Public ownership percentages
Technical Filters
- RSI (14-day)
- MACD, MACD Signal, MACD Histogram
- SMA (9, 20, 50, 100, 200-day)
- EMA (9, 20, 50, 100, 200-day)
- Stochastic %K and %D
- CCI (20-day), Williams %R, ADX (14-day), ATR (14-day)
- Bollinger Bands (upper, middle, lower)
- Daily signal (Buy, Sell, Neutral)
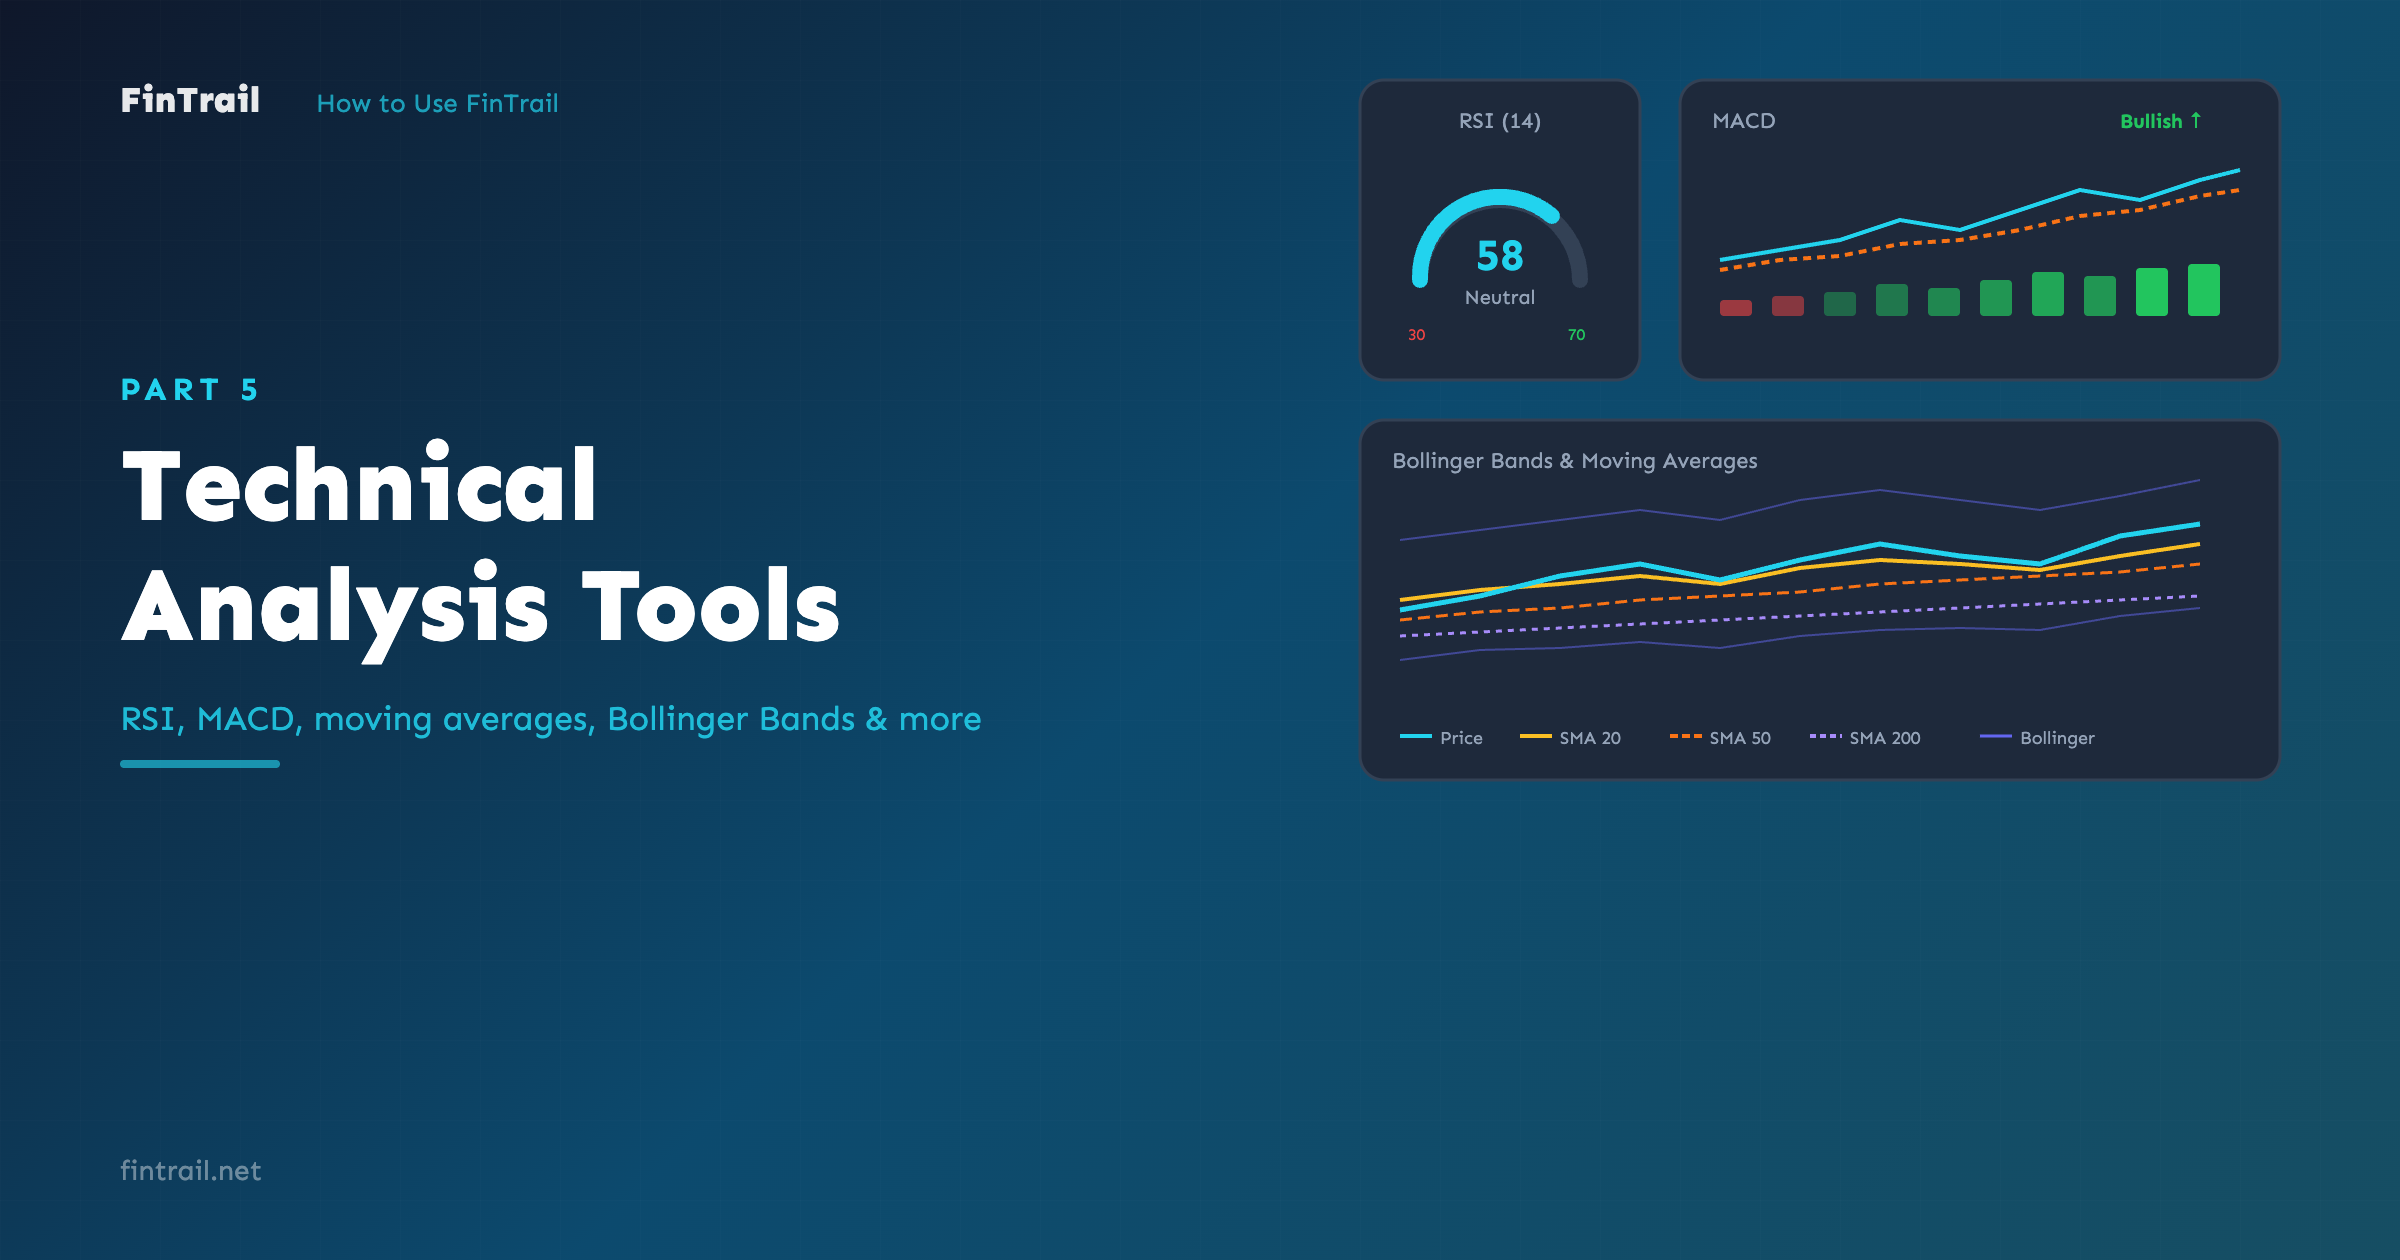
For a detailed explanation of each technical indicator, see Part 5: Technical Analysis Tools.
Each filter lets you set a minimum, maximum, or both. Some price-related filters have preset ranges (like “Under ৳10”, “৳10–৳50”) for quick selection.
Data Tabs
The results table has seven tabs, each showing a different set of columns:
- Overview — price, change, volume, market cap, P/E, EPS, dividend yield, sector
- Performance — price changes across multiple timeframes (1W, 1M, 3M, YTD, 1Y, distance from 52W high/low)
- Valuation — market cap, P/E, P/B, EPS, NAV, face value
- Fundamentals — EPS (annual + quarterly), NAV, paid-up capital, reserve, yearly profit, total shares
- Dividends — dividend percentage, dividend yield, EPS, P/E
- Shareholding — sponsor, government, institutional, foreign, public percentages
- Technicals — RSI, MACD, SMA 20/50/200, Stochastic %K, ADX, daily signal
Switch tabs to analyze the same filtered results from different angles without changing your filters.
Sorting
Click any column header to sort results. Click again to toggle between ascending and descending order. The current sort column and direction are highlighted.
Saving Screeners
Once you have built a useful combination of filters, save it for reuse:
- Set up your filters
- Click Save Screener
- Give it a name (e.g., “Undervalued High Dividend” or “Momentum Breakout”)
Your saved screeners appear alongside the predefined ones. Load any saved screener with a single click.
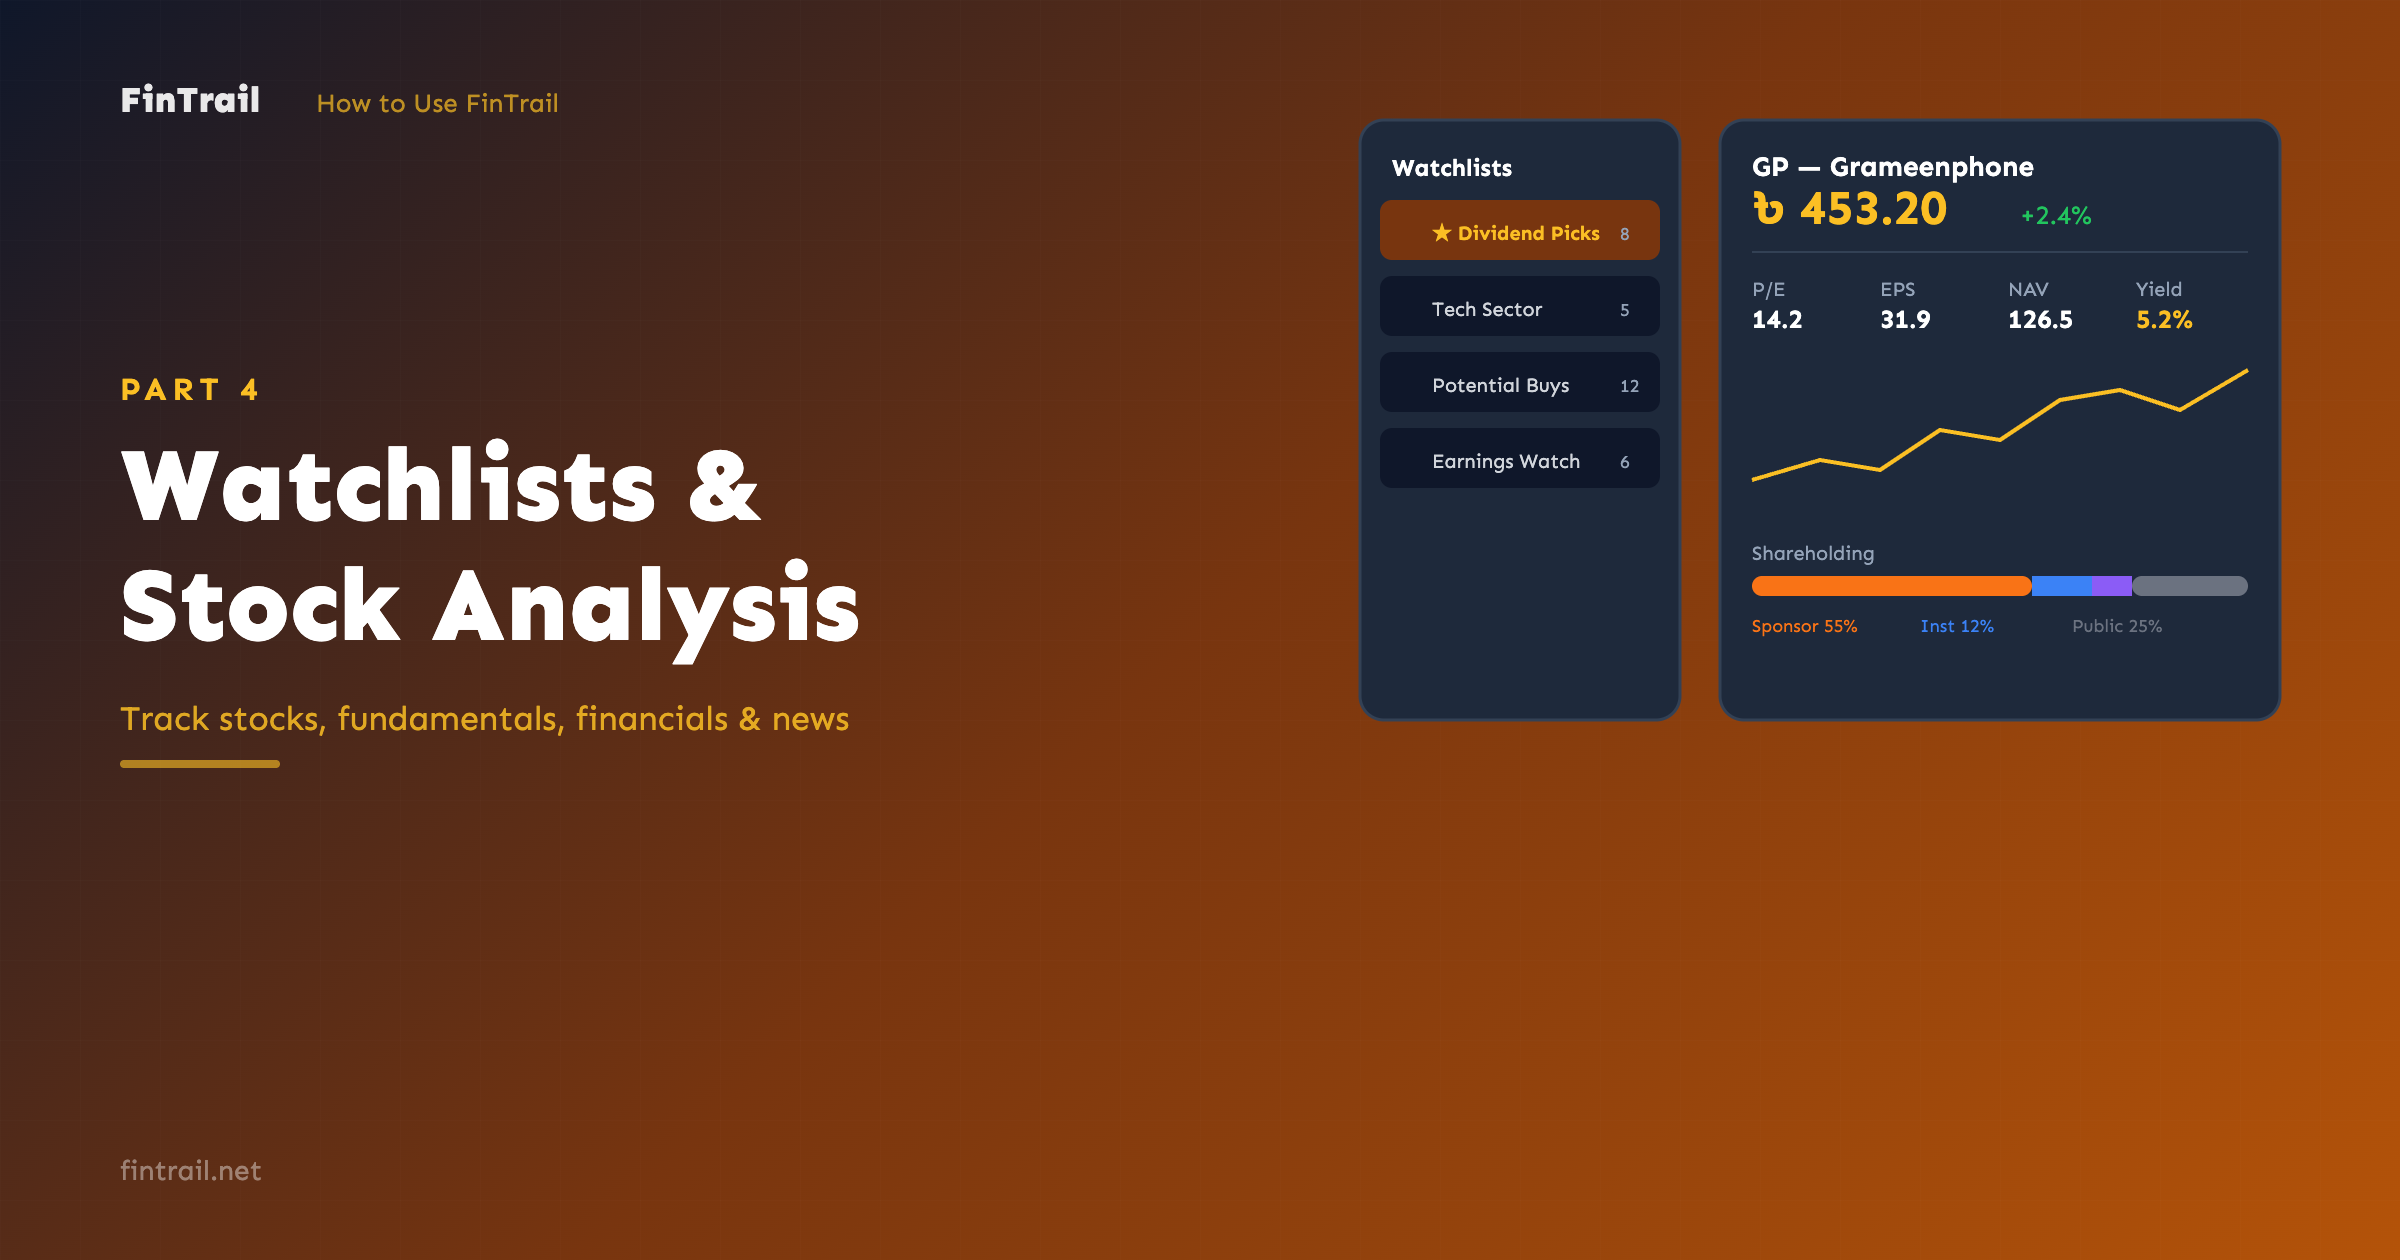
Adding to Watchlist
While browsing screener results, you can add stocks directly to your watchlists without leaving the page. This makes it easy to build a shortlist from your screening session.
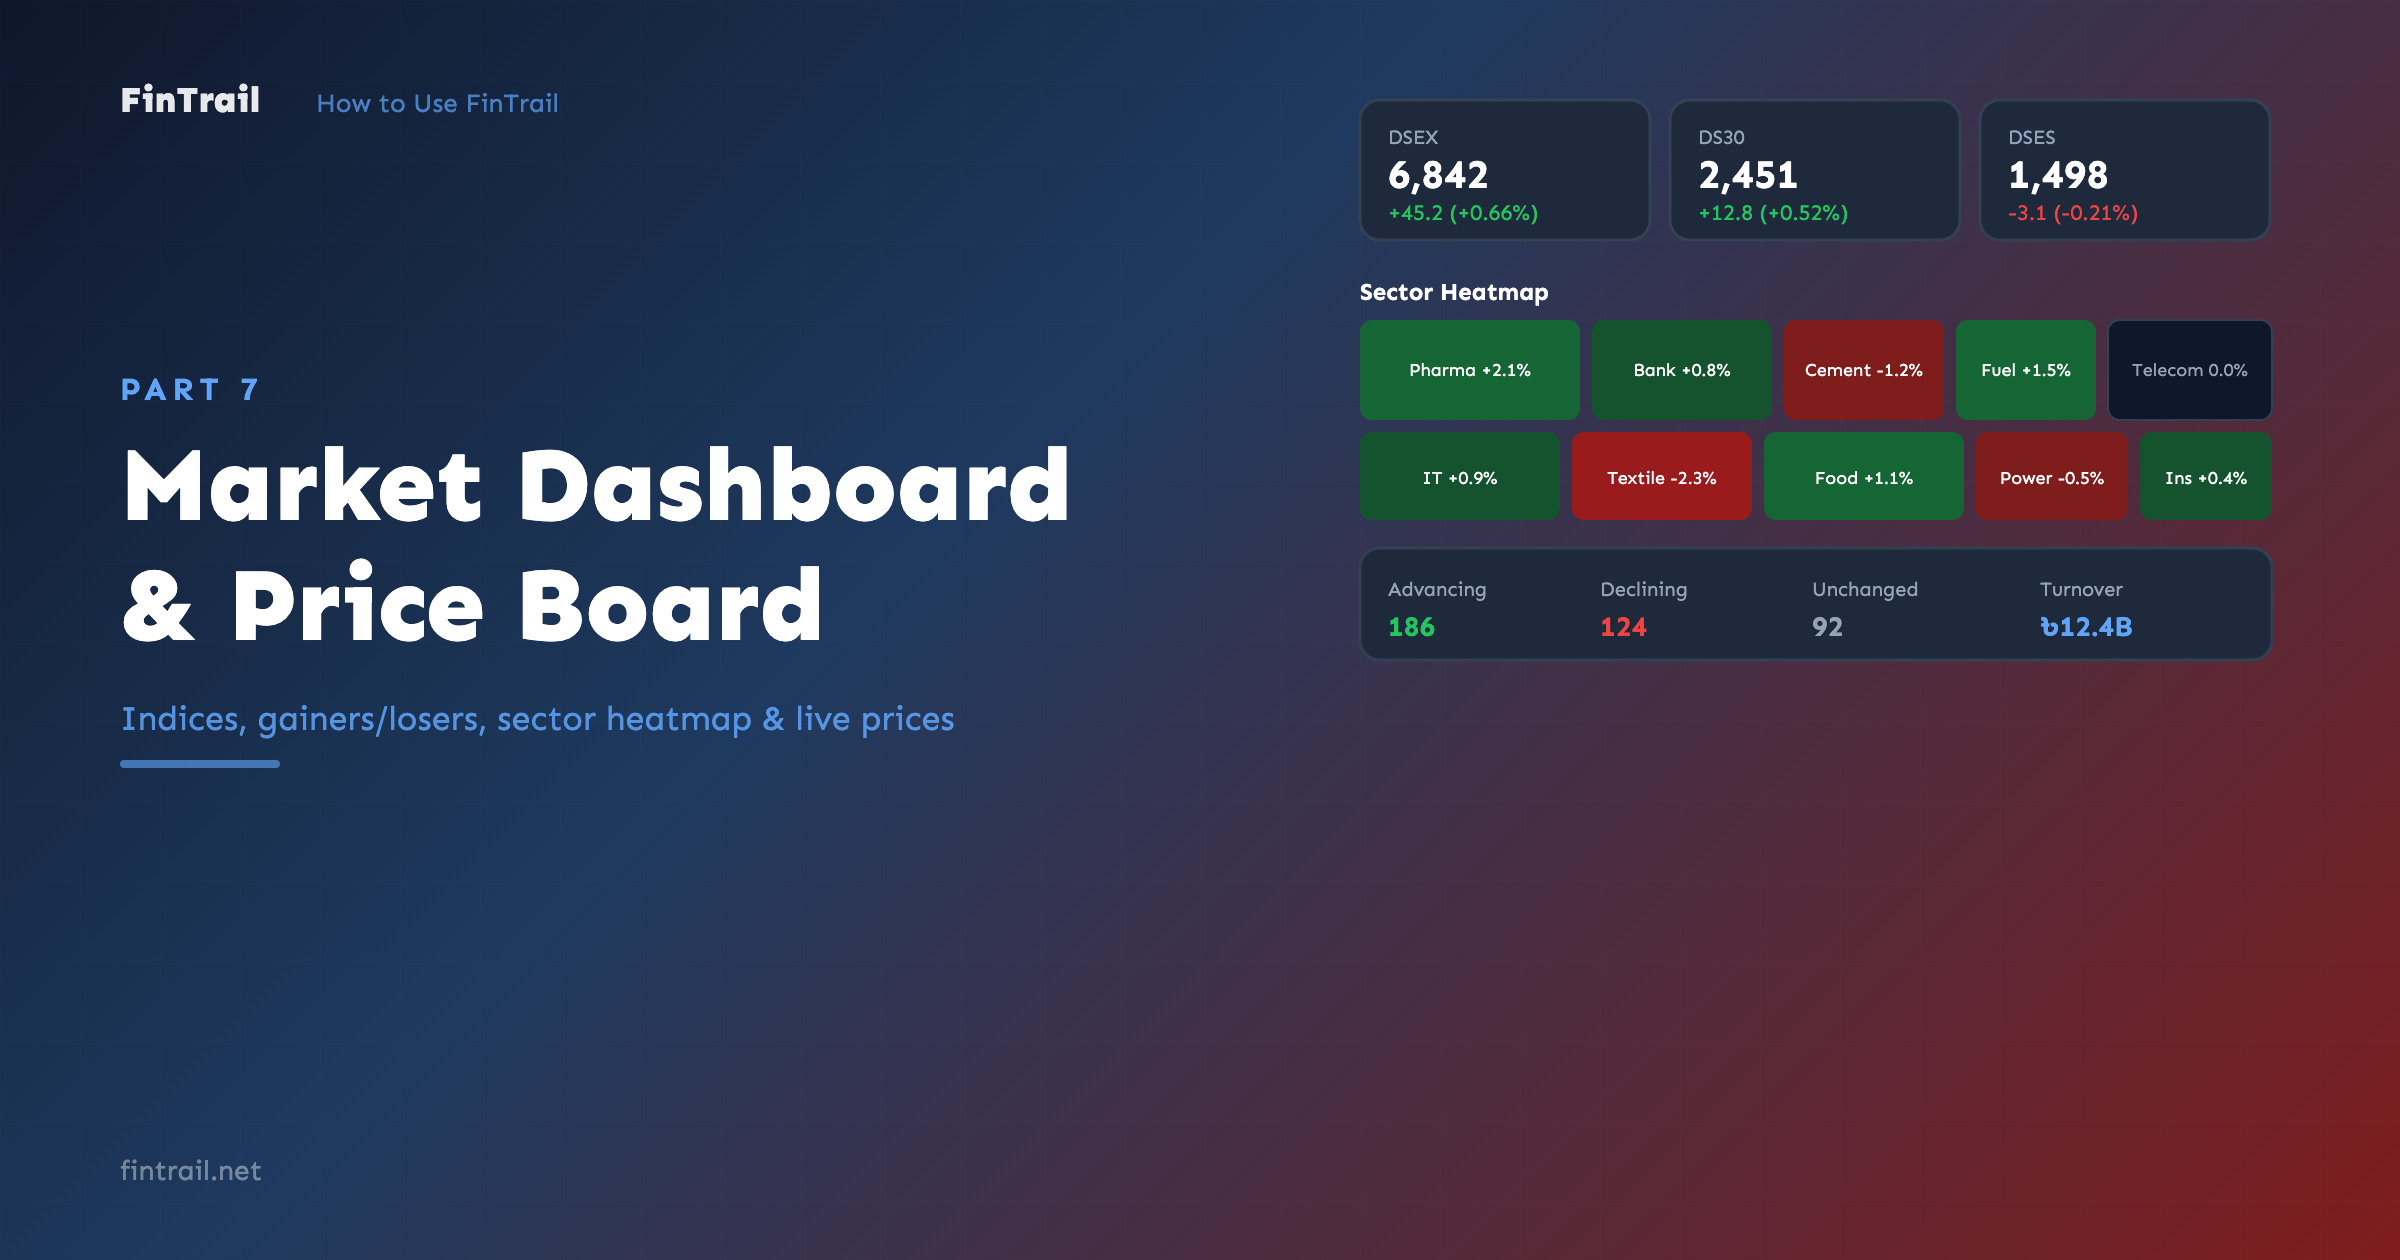
What is Next
Now you can screen the entire DSE market with precision. In Part 7, we look at the Market Dashboard and Price Board — your real-time overview of market indices, sector performance, and live prices for all stocks.
This is Part 6 of the How to Use FinTrail series. ← Previous: Technical Analysis Tools. Continue to Part 7: Market Dashboard & Price Board.