While the portfolio dashboard focuses on your holdings, the Market Dashboard gives you a bird’s-eye view of the entire Dhaka Stock Exchange. It is the quickest way to understand what is happening in the market right now.
Market Dashboard
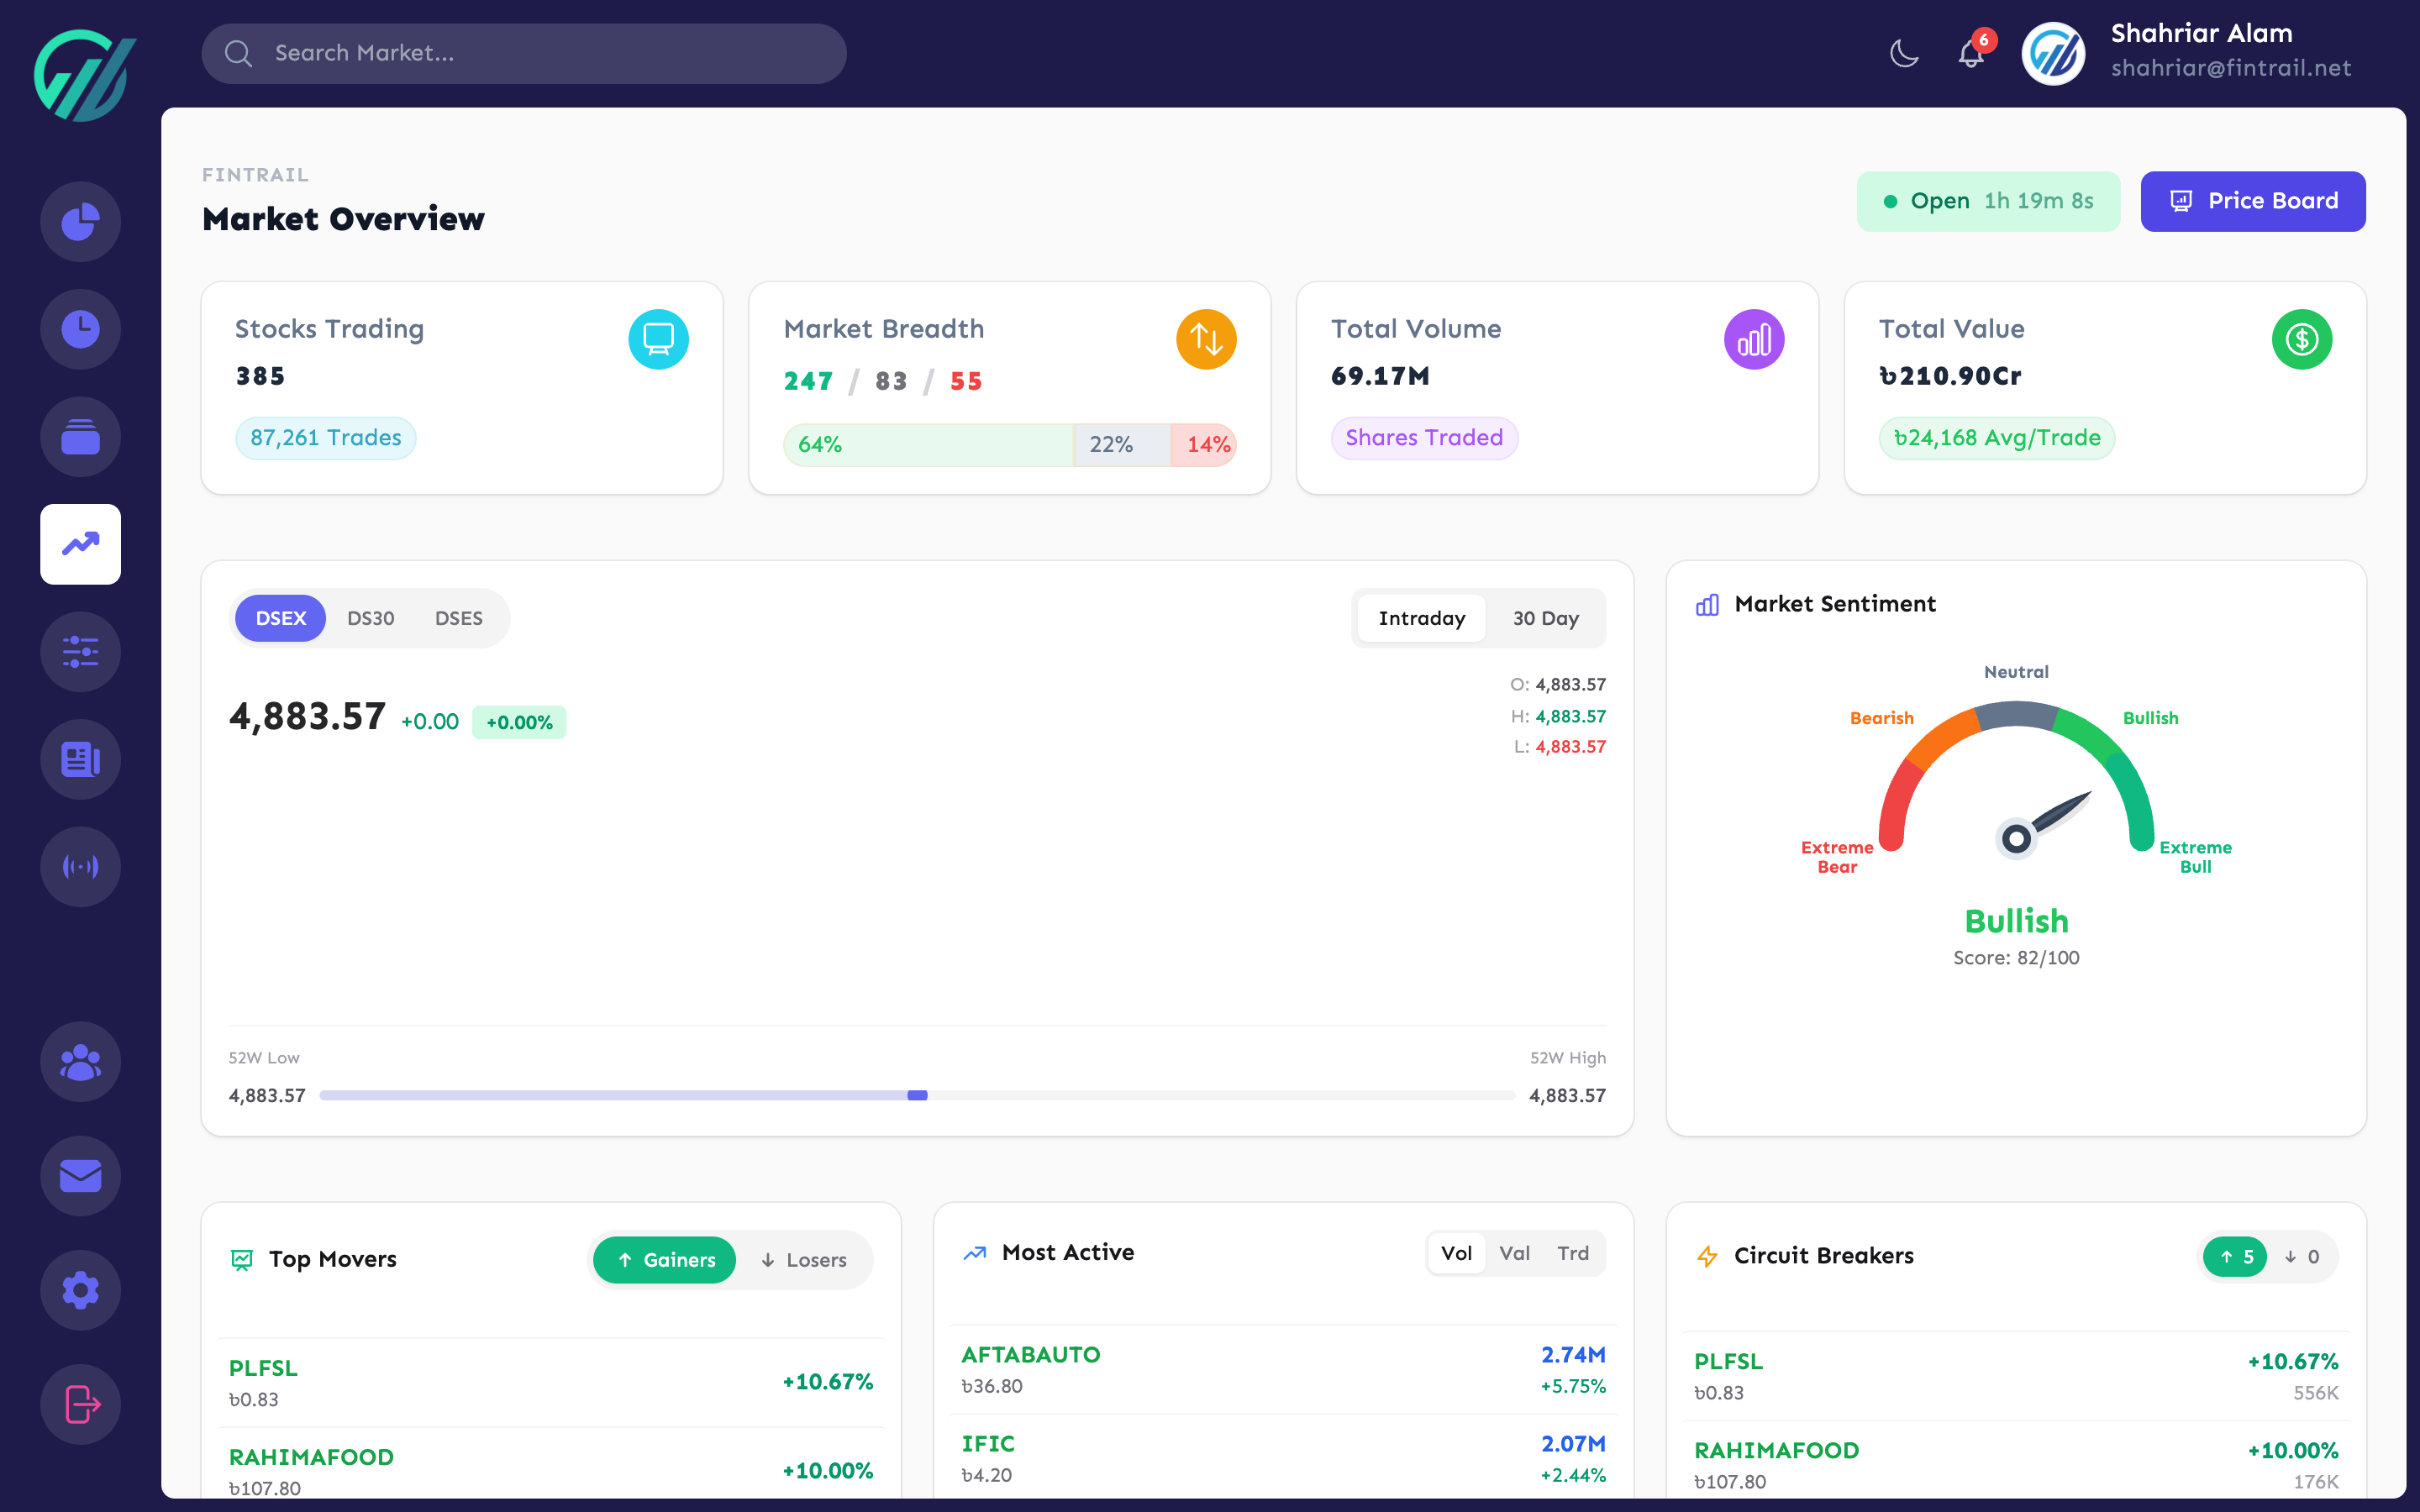
The Market Dashboard pulls together all the key market data into one screen, updated every 30 seconds during trading hours (Sunday–Thursday, 10:00 AM – 2:30 PM Bangladesh time).
Index Values
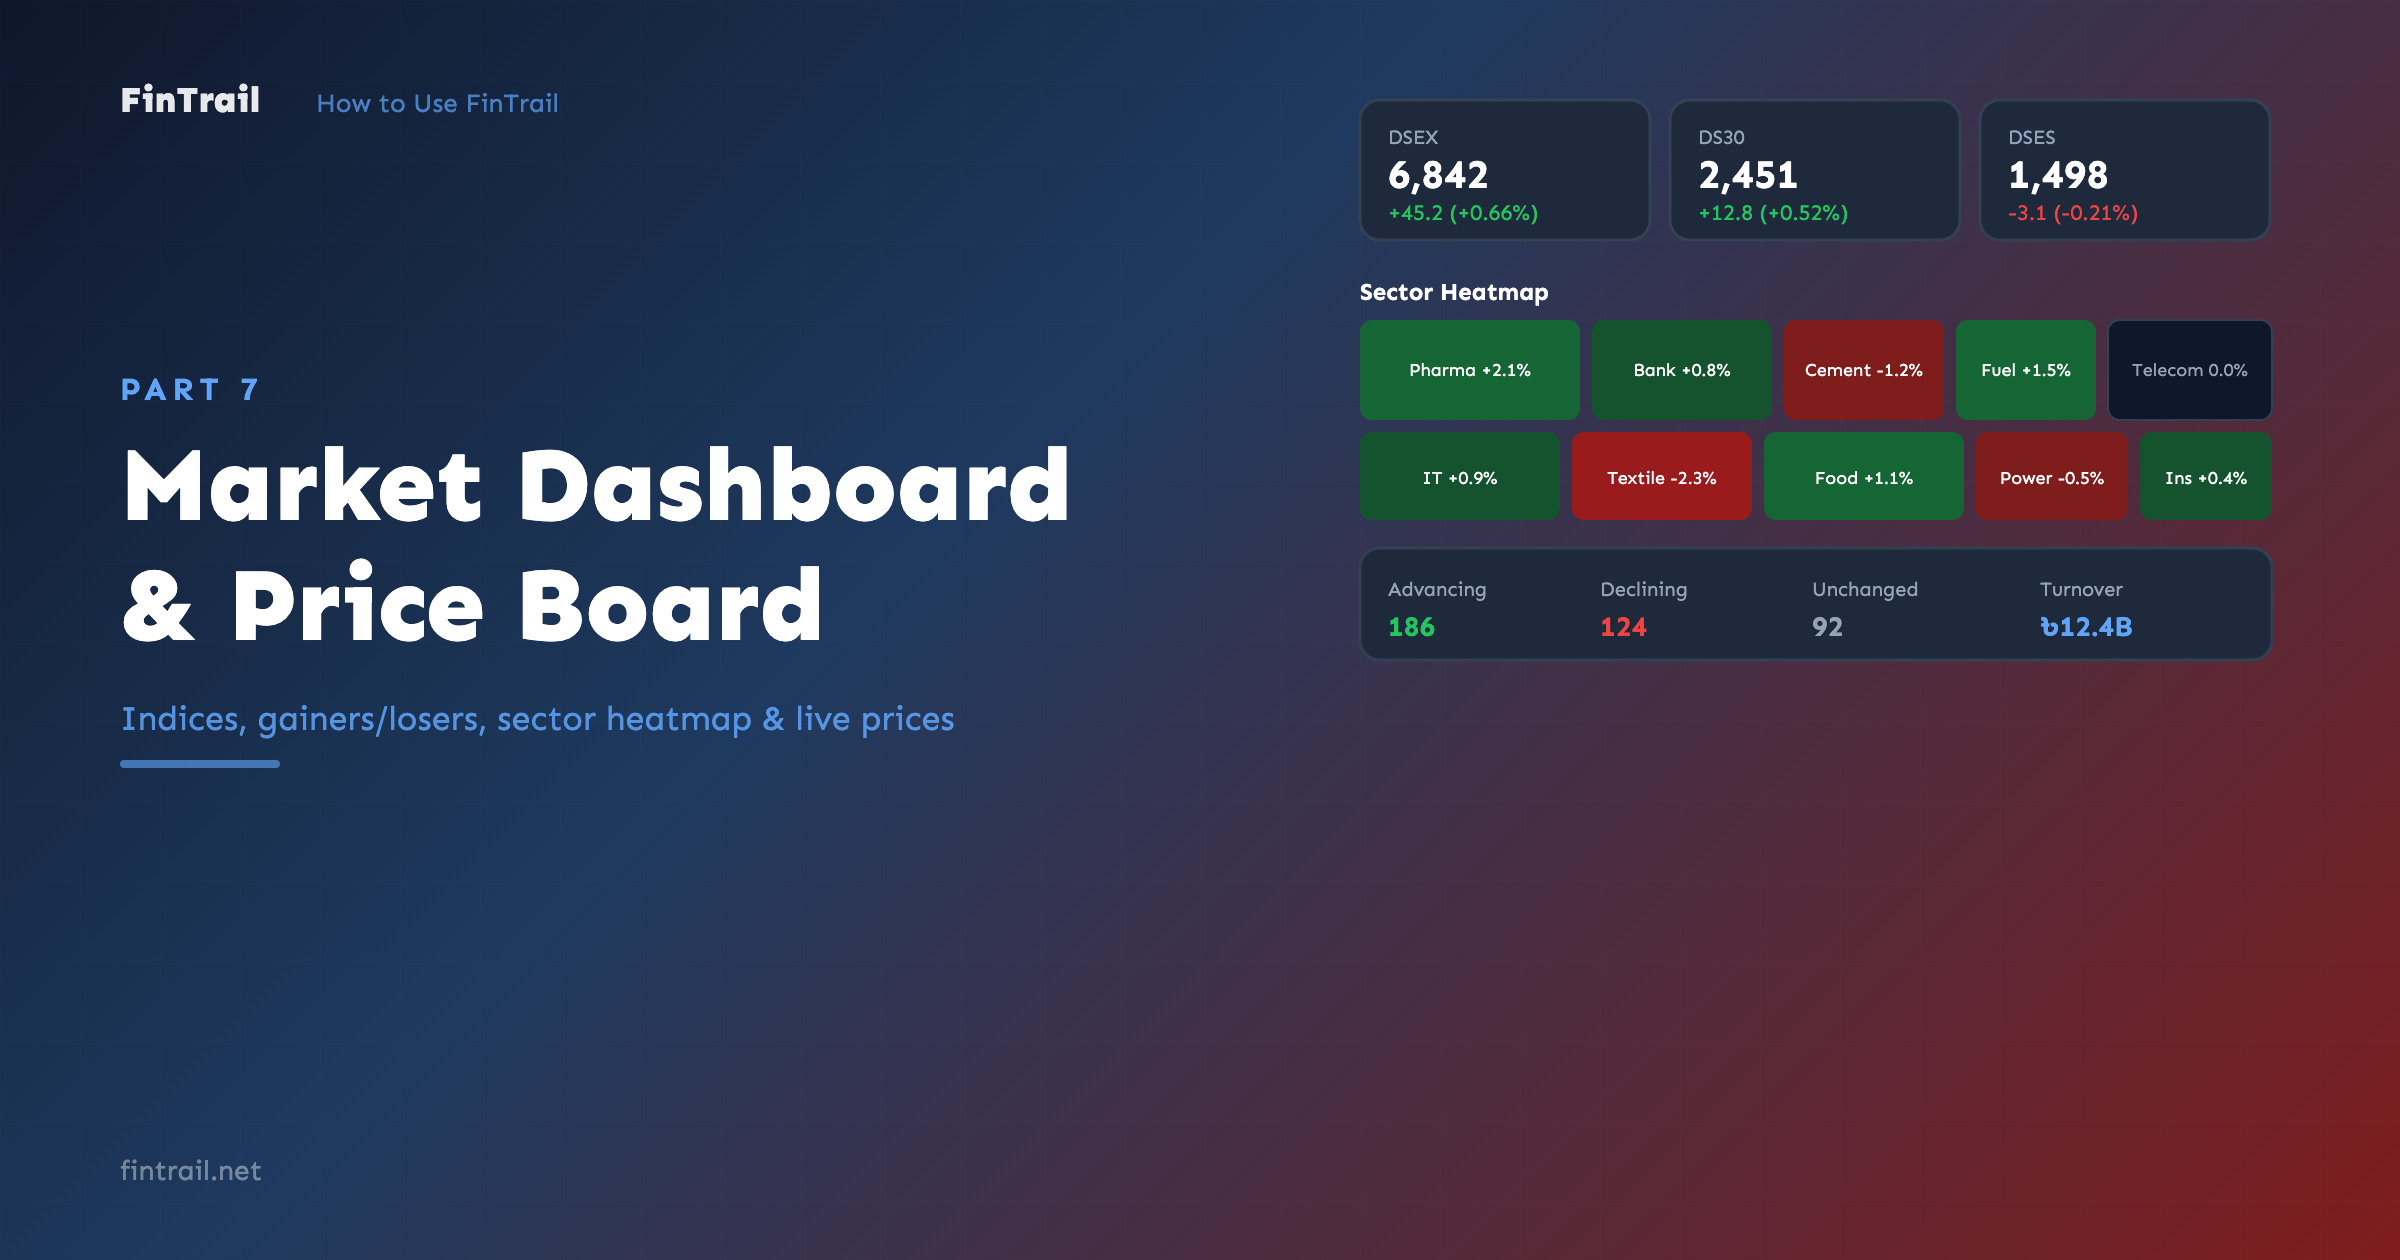
At the top, you see the three DSE indices:
- DSEX — the broad market index covering all eligible stocks
- DS30 — the top 30 stocks by free-float market cap and turnover
- DSES — the Shariah index for Shariah-compliant securities
Each index shows its current value, change amount, and change percentage. This gives you an instant feel for whether the market is up or down overall.
Top Gainers & Losers
Two side-by-side lists show the stocks with the biggest percentage gains and losses for the day. Each entry shows the stock symbol, current price, and percentage change. This is useful for spotting momentum and unusual moves.
Sector Heatmap
The heatmap visualizes how each sector is performing. Sectors are color-coded — green for positive performance, red for negative. The intensity of the color reflects the magnitude of the change. At a glance, you can see which sectors are leading and which are lagging.
Market Sentiment
An overview of market breadth:
- How many stocks are advancing vs. declining
- Total market turnover
- Overall market direction
This helps you understand whether the broader market is participating in a move or if it is being driven by just a few stocks.
Trading Status
The dashboard shows the current market status — whether trading is open, closed, or in a pre/post session. During off-hours, the data shown is from the last trading session.
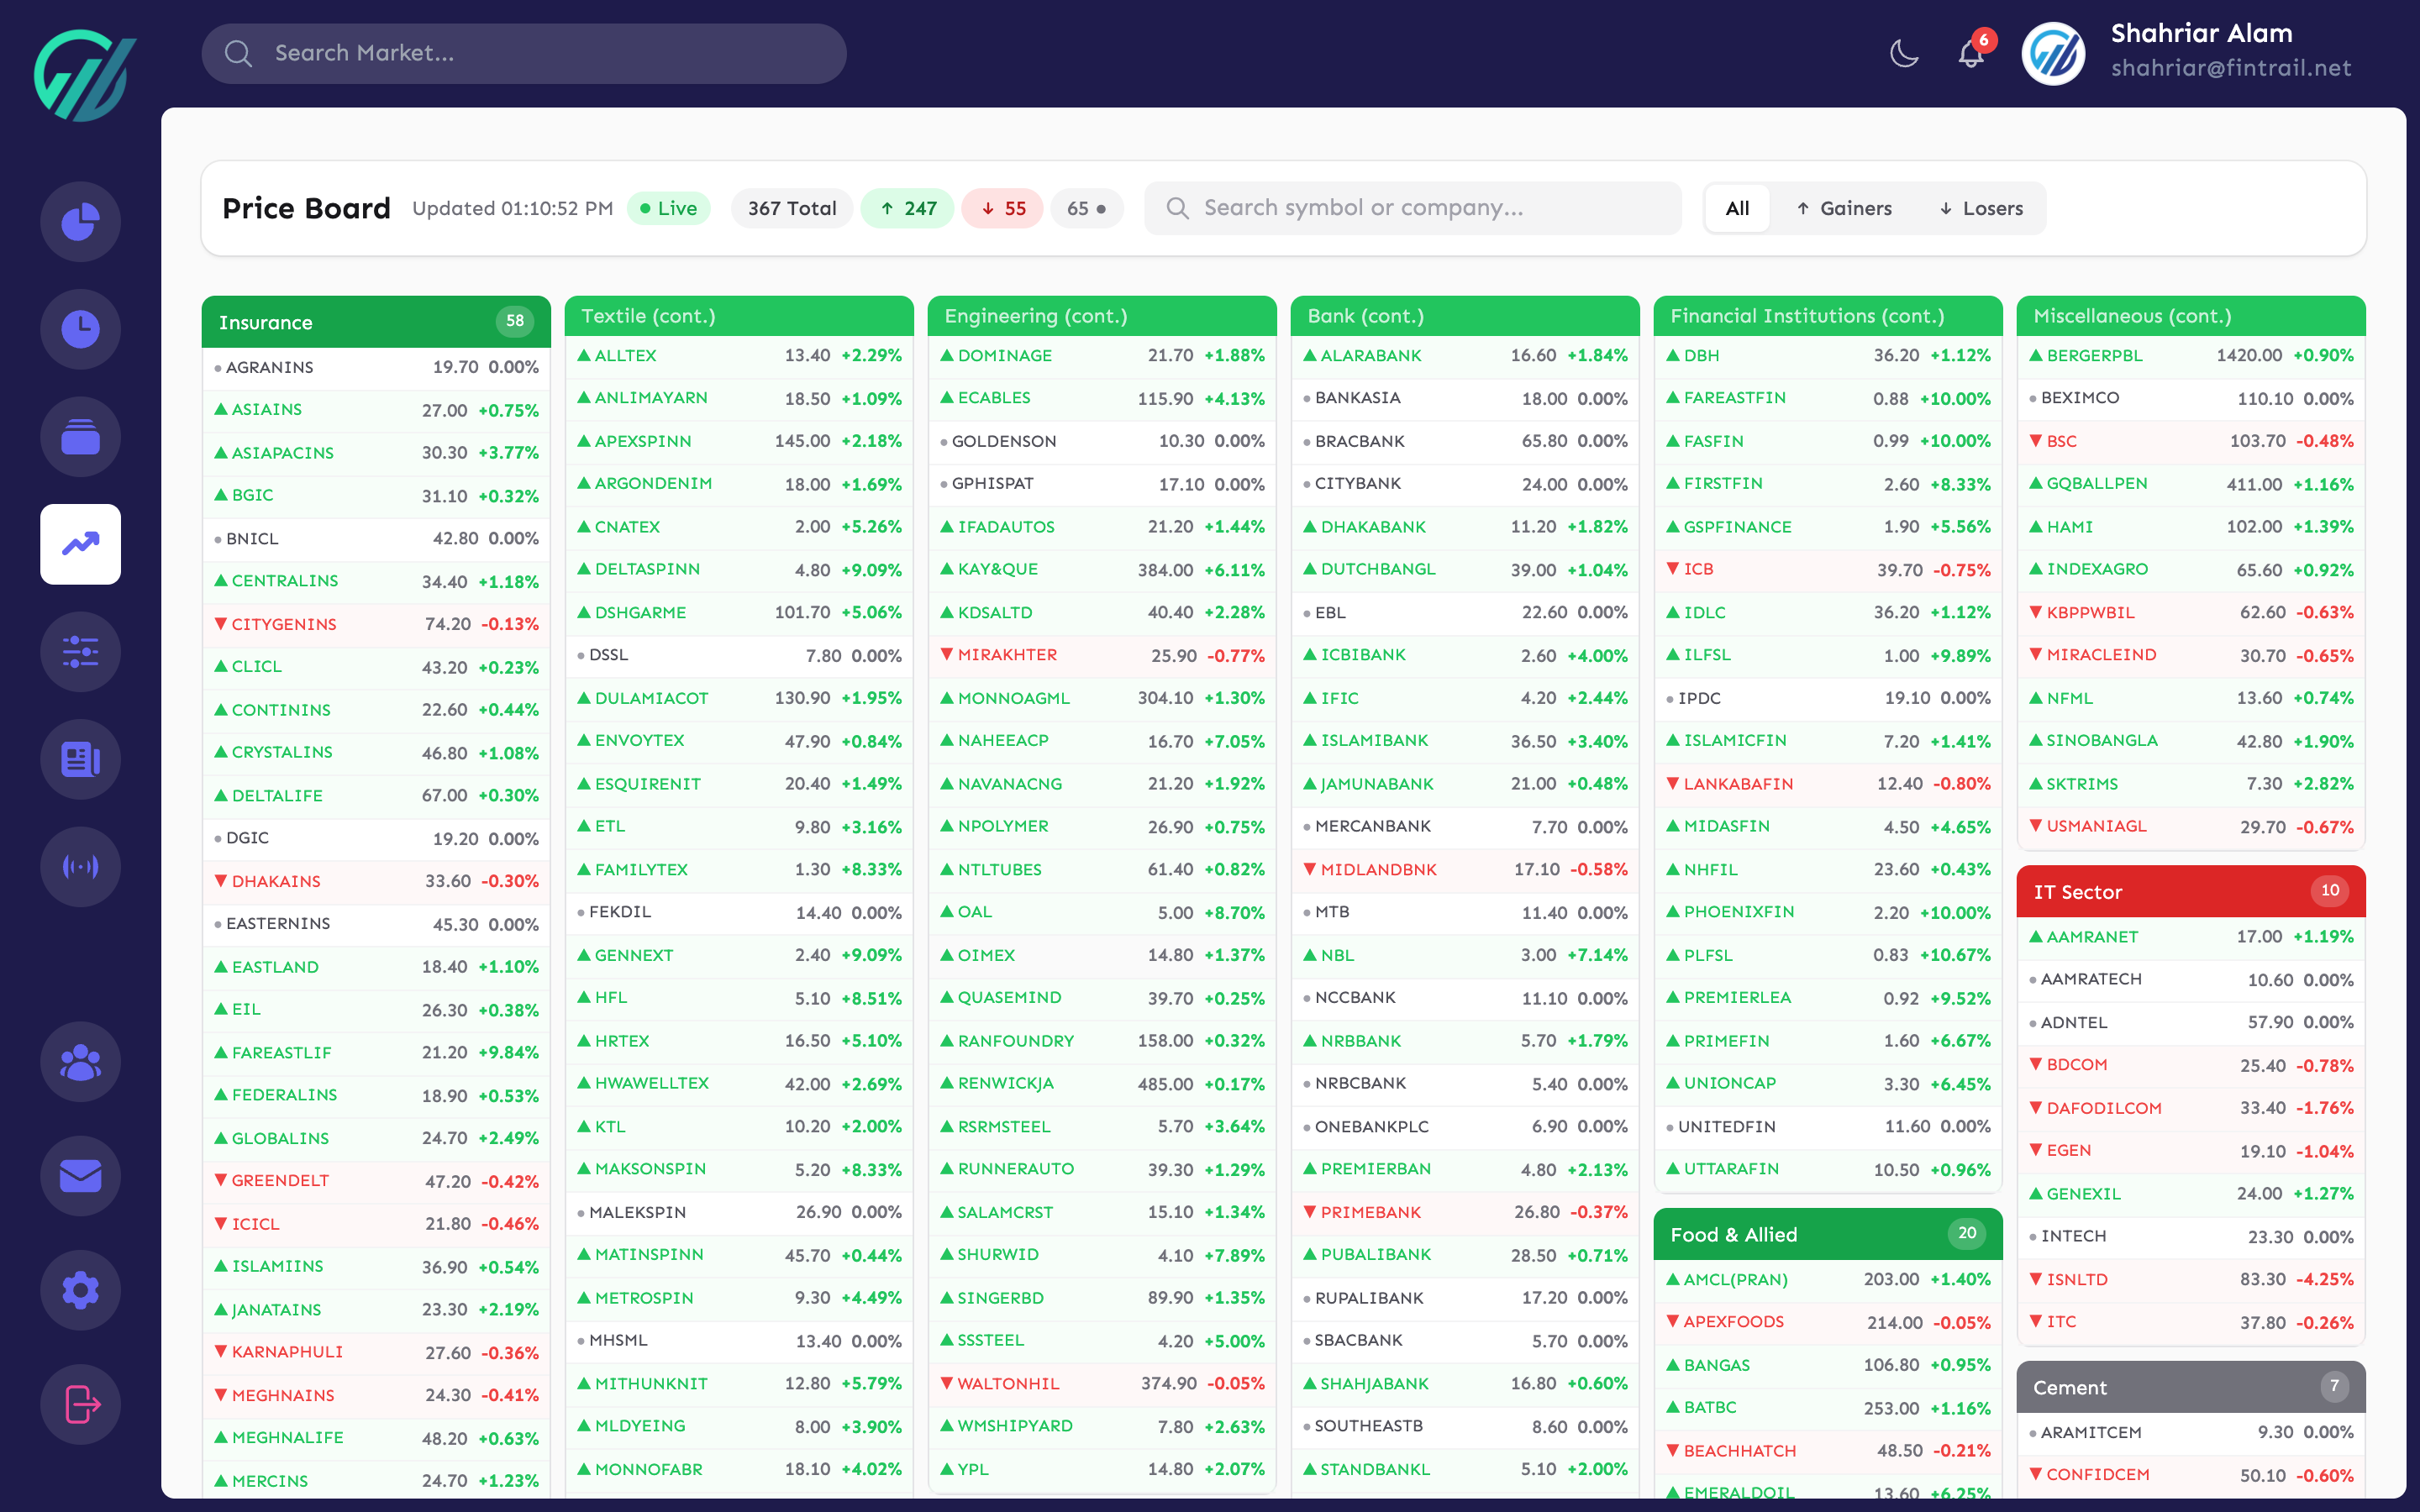
Price Board
The Price Board is a dedicated page showing live prices for all DSE stocks in a compact, scannable format. While the Stocks page includes watchlist management and other features, the Price Board is focused purely on prices.
Features
- All stocks at a glance — every listed stock with its LTP, change, and volume
- Sector filter — filter the board by sector to focus on a specific industry
- Live updates — refreshes every 30 seconds during market hours, every 5 minutes outside trading hours
- Compact layout — designed to show as many stocks as possible on screen
The Price Board is ideal for monitoring the market in real time during trading hours. Keep it open in a tab alongside your portfolio dashboard for a complete picture of both your positions and the broader market.
What is Next
Now you have the tools to monitor the full market. In Part 8, we dive into Price Alerts — how to set up automated notifications so you never miss a price move.
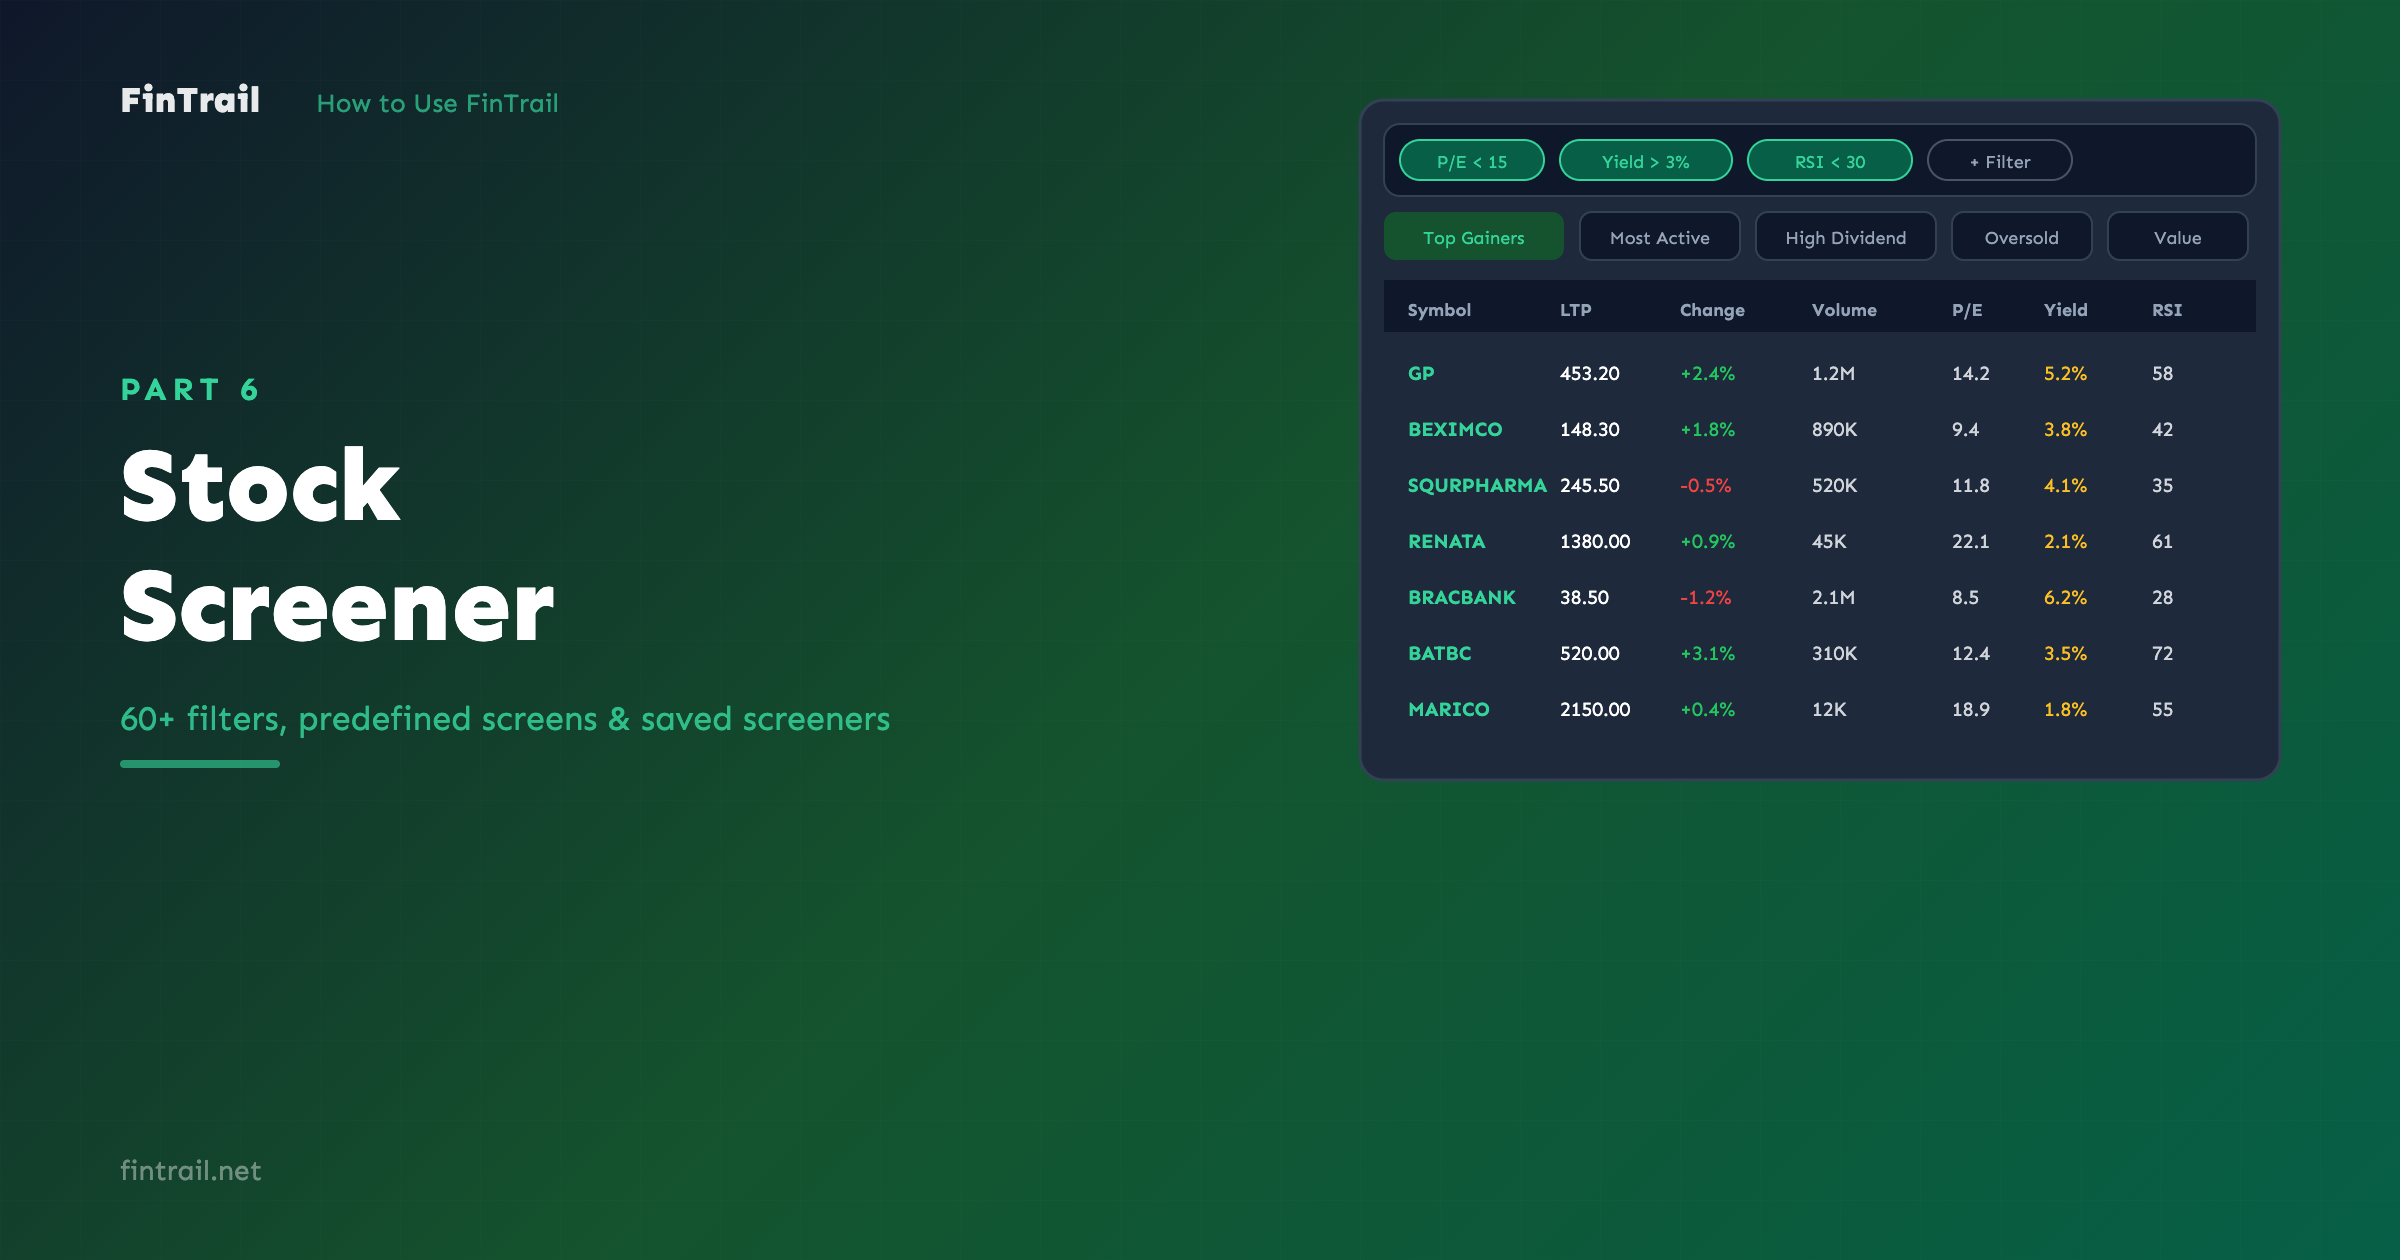
This is Part 7 of the How to Use FinTrail series. ← Previous: Stock Screener. Continue to Part 8: Price Alerts.