Before you buy a single share, you need to understand what a company actually looks like on paper. Financial statements are the X-ray of a business — they reveal what marketing materials never will. The good news: you don’t need an accounting degree to read them. You just need to know where to look and what matters.
Where to Find Financial Statements
Every DSE-listed company is required to publish quarterly and annual financial statements. You can find them in several places:
- DSE website (dse.com.bd) — Go to Company Listings, search by trading code, and look under “Financial Statements” or “Company Declarations”
- Company’s own website — Usually under an “Investor Relations” section
- Annual reports — Published yearly, these contain the full audited financials along with management commentary
For most practical purposes, the quarterly earnings reports on the DSE website are enough for regular analysis.
The Three Core Statements
Every company publishes three interconnected financial statements. Think of them as answering three different questions about the same business.
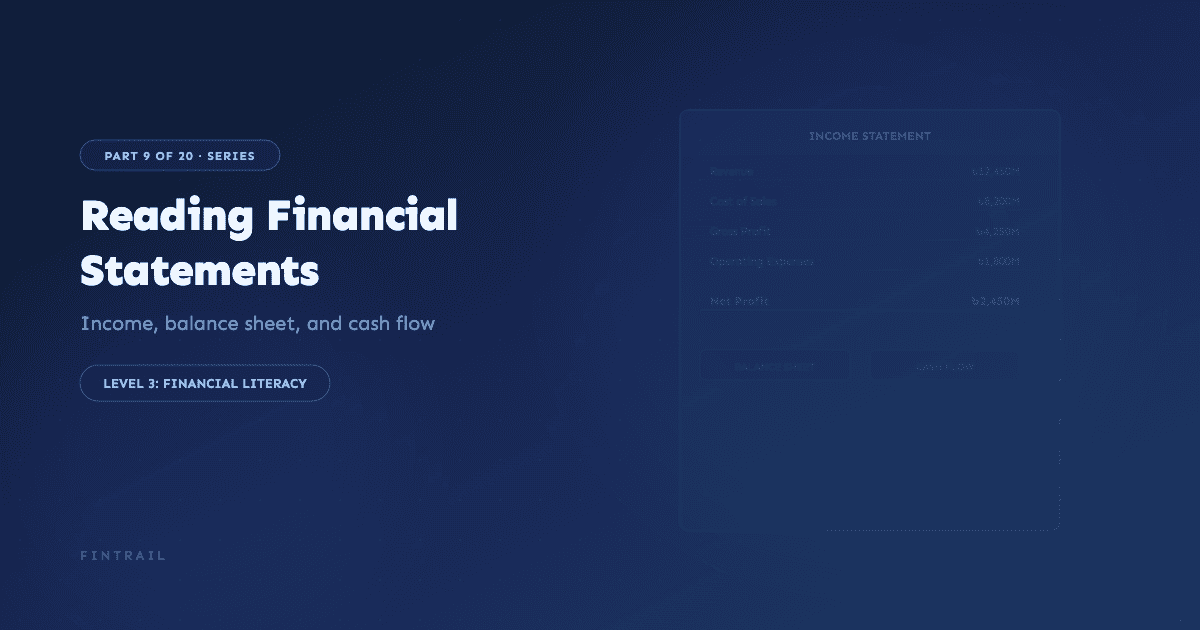
1. Income Statement (Profit & Loss Account)
Question it answers: How much did the company earn or lose during this period?
This is where most investors look first. In Bangladesh, the income statement typically follows this structure:
| Line Item | Example (Annual) |
|---|---|
| Revenue / Turnover | ৳4,500 crore |
| Cost of Goods Sold | (৳2,700 crore) |
| Gross Profit | ৳1,800 crore |
| Operating Expenses | (৳600 crore) |
| Operating Profit | ৳1,200 crore |
| Finance Costs | (৳150 crore) |
| Other Income | ৳50 crore |
| Profit Before Tax | ৳1,100 crore |
| Tax Expense | (৳330 crore) |
| Net Profit After Tax | ৳770 crore |
| EPS | ৳16.20 |
What to focus on:
- Revenue growth — Is the top line growing year over year? A company can cut costs to boost profits temporarily, but sustainable growth needs rising revenue.
- Gross margin (Gross Profit / Revenue) — This shows how efficiently the company produces its goods. A pharma company might have 40% gross margins; a textile company might have 15%.
- Net profit margin (Net Profit / Revenue) — What percentage of each taka of revenue actually becomes profit? Compare this across years and against sector peers.
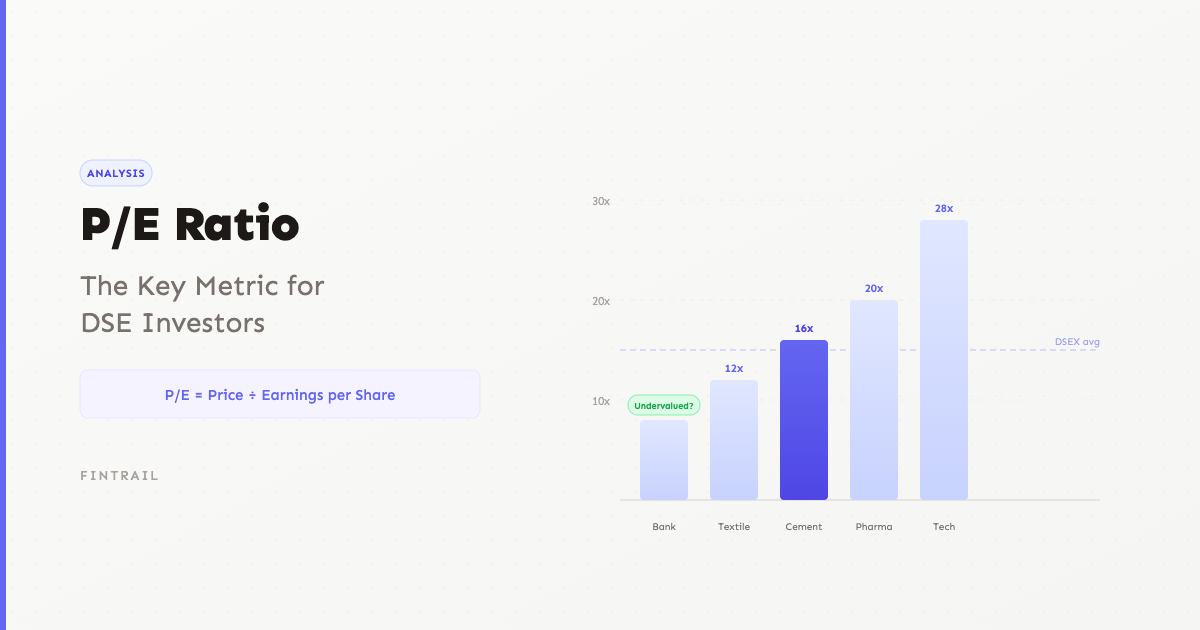
- EPS — Earnings Per Share is the bottom line divided by total shares outstanding. This is the number that drives P/E valuations.
2. Balance Sheet (Statement of Financial Position)
Question it answers: What does the company own, what does it owe, and what’s left for shareholders?
The balance sheet is a snapshot of a single moment in time. It follows the fundamental equation:
Assets = Liabilities + Shareholders’ Equity
| Category | Example |
|---|---|
| Assets | |
| Cash & Equivalents | ৳200 crore |
| Accounts Receivable | ৳350 crore |
| Inventories | ৳400 crore |
| Property, Plant & Equipment | ৳1,500 crore |
| Total Assets | ৳2,450 crore |
| Liabilities | |
| Short-term Borrowings | ৳300 crore |
| Accounts Payable | ৳250 crore |
| Long-term Debt | ৳500 crore |
| Total Liabilities | ৳1,050 crore |
| Shareholders’ Equity | ৳1,400 crore |
What to focus on:
- Debt-to-equity ratio (Total Debt / Equity) — A ratio above 1.0 means the company owes more than shareholders have invested. For most DSE sectors, below 0.5 is comfortable. Banks are different — they operate on leverage by design.
- Current ratio (Current Assets / Current Liabilities) — Above 1.5 is generally healthy. Below 1.0 means the company may struggle to pay short-term obligations.
- NAV per share (Equity / Total Shares) — This is the book value. If a stock trades below NAV, it might be undervalued — or the market may see trouble ahead.
3. Cash Flow Statement
Question it answers: Where did the cash actually come from, and where did it go?
This is the statement most investors skip, but it’s arguably the most important. Profit on the income statement can be manipulated through accounting choices. Cash flow is much harder to fake.
The cash flow statement has three sections:
- Operating Activities — Cash generated from the core business. This should be positive and ideally growing. If a company reports rising profits but declining operating cash flow, that’s a warning sign.
- Investing Activities — Cash spent on long-term assets (factories, equipment, acquisitions). Usually negative, which is fine — it means the company is investing in growth.
- Financing Activities — Cash from borrowing, issuing shares, or paying dividends. This tells you how the company funds itself.
The golden rule: A healthy company generates positive cash from operations, invests in its future, and manages its financing responsibly. If a company consistently needs to borrow just to keep operations running, proceed with caution.
Connecting the Dots
The real insight comes from reading all three statements together:
- A company shows growing net profit (income statement), but accounts receivable are ballooning (balance sheet). This might mean they’re booking revenue from customers who haven’t actually paid.
- Operating profit looks great, but cash flow from operations is negative. The company might be tying up cash in inventory or giving overly generous credit terms.
- Revenue is flat, but EPS keeps rising. Check whether the company has been buying back shares (fewer shares outstanding means higher EPS) or if they’ve just been cutting costs — which has limits.
A Practical Approach for DSE Investors
You don’t need to analyze every line item. Here’s a focused checklist:
- Revenue trend — Has it grown over the past 3-5 years?
- Net profit margin — Is it stable or improving?
- EPS trend — Consistent growth, or volatile?
- Debt levels — Is the debt-to-equity ratio reasonable for the sector?
- Cash from operations — Positive and growing?
- Dividend history — Can the company afford its dividends from operating cash flow?
If a company passes these six checks, it’s worth a deeper look. If it fails multiple checks, move on — there are 400+ stocks on the DSE, and you only need a handful of good ones.
Reading Financial Statements with FinTrail
FinTrail displays key financial data for every DSE-listed stock — EPS, NAV, P/E, debt ratios, and more — so you can quickly screen companies without manually digging through PDFs. The screener lets you filter by any fundamental metric and compare across sectors.
Financial statements aren’t exciting reading, but they’re the foundation of every sound investment decision. Learn to read them, and you’ll already be ahead of most participants in the market.
Think About This
- If a company’s net profit is rising but its cash flow from operations is falling, what could that indicate about the quality of its earnings?
- Why might two companies in the same sector with similar revenue have very different net profit margins?
- When you look at a balance sheet, what would concern you more — high debt or low cash? Why might the answer depend on the industry?