“DSEX fell 47 points today.” You hear this on the news, read it in newspaper headlines, see it flash across ticker screens in broker offices. But what does it actually mean? And should you care?
Understanding market indices is essential for any DSE investor. They’re the pulse of the market — but only if you know how to read them.
What Is a Market Index?
A market index is a number that represents the overall performance of a group of stocks. Think of it as a summary score for the market, the way your body temperature tells you if something is generally right or wrong with your health.
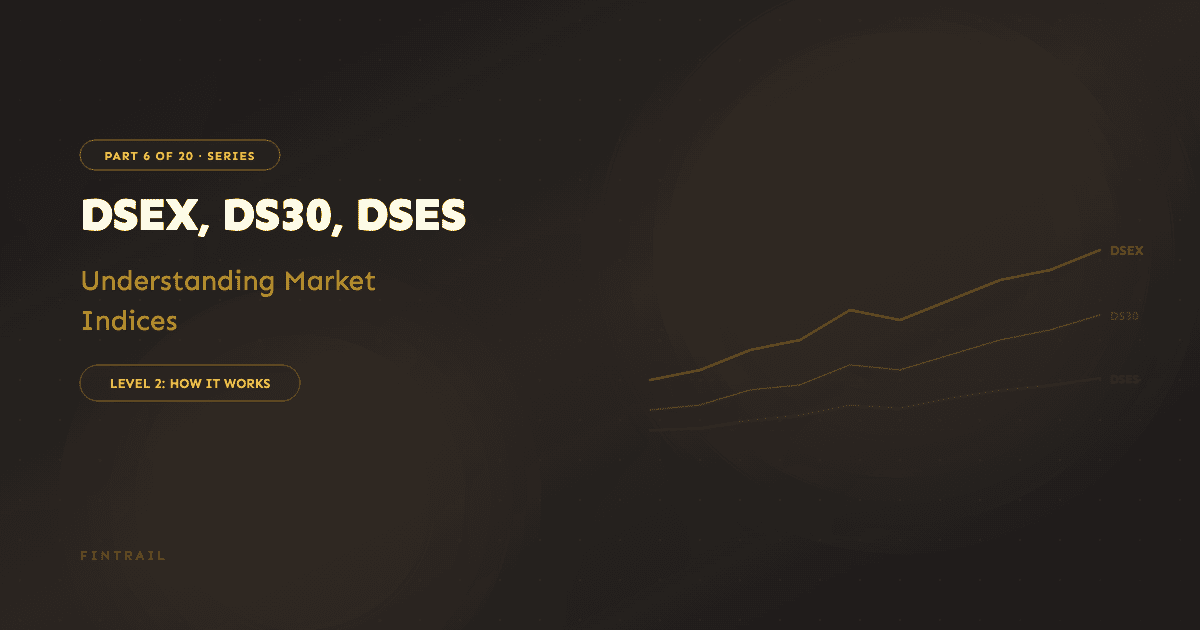
The DSE has three main indices, each measuring something slightly different.
DSEX: The Broad Market Index
DSEX is the primary benchmark index of the Dhaka Stock Exchange. When people say “the market went up” or “the market crashed,” they’re almost always referring to DSEX.
What It Includes
DSEX covers the majority of listed companies on the DSE, excluding Z category and certain other restricted stocks. It’s a free-float adjusted, market capitalization-weighted index. That’s a mouthful, so let’s break it down:
- Market capitalization-weighted: Larger companies have more influence on the index. If a company with a ৳50,000 crore market cap moves 2%, it affects DSEX much more than a company with a ৳500 crore market cap moving 2%.
- Free-float adjusted: Only the shares available for public trading count toward the weight. If a company’s sponsors hold 60% of shares, only the remaining 40% (the free float) is used in the calculation.
What the Number Means
DSEX started with a base value of 1,000 in 2008 (recalculated from historical data). When DSEX is at 5,500, it means the combined market capitalization of the index components, adjusted for free float, has grown substantially since the base period.
A 1% move in DSEX — roughly 55 points when the index is around 5,500 — means the overall market value has shifted by 1%.
Why DSEX Matters
DSEX gives you the big picture. If DSEX is trending upward over weeks and months, it means money is flowing into the market broadly. If it’s declining, money is flowing out. For investors, this context is critical because most stocks follow the broad market direction, at least in the short term.
DS30: The Blue-Chip Index
DS30 tracks the 30 largest and most liquid stocks on the DSE. Think of it as the index of “established, reputable companies.”
How It’s Different from DSEX
While DSEX captures the broad market, DS30 focuses specifically on:
- Companies with the highest market capitalization
- Companies with the best trading liquidity (high daily turnover)
- Companies that meet certain governance and financial criteria
The composition is reviewed periodically, so companies can be added or removed based on these criteria.
Why DS30 Matters
DS30 tells you what the “big money” is doing. Institutional investors, foreign portfolio investors, and large domestic funds tend to invest primarily in DS30-type stocks. If DS30 is rising while DSEX is flat, it suggests money is concentrating in blue-chips — a sign of risk aversion.
Conversely, if DSEX is rising faster than DS30, it means smaller and mid-cap stocks are leading the rally — which can indicate broad-based optimism but also potentially speculative behavior.
DSES: The Shariah Index
DSES (DSE Shariah Index) tracks companies that comply with Islamic financial principles. For the growing number of investors who want Shariah-compliant portfolios, DSES is the key benchmark.
What Makes a Stock Shariah-Compliant?
Companies in DSES must meet specific criteria related to:
- Business activity: Core revenue must come from halal activities. Banks that charge interest, conventional insurance companies, alcohol and tobacco companies are typically excluded.
- Financial ratios: Debt levels, interest income, and cash holdings must stay within prescribed limits.
- A Shariah advisory board reviews compliance regularly.
Why DSES Matters
Beyond religious compliance, DSES stocks tend to be lower-leverage companies (because of debt restrictions), which can mean more stable performance during market downturns. It’s worth watching even if Shariah compliance isn’t your primary concern.
How to Read Index Movements
Now that you know what the indices are, here’s how to actually interpret their movements:
Daily Changes: Keep Perspective
A 30-point move in DSEX when the index is at 5,500 represents about 0.5%. That’s normal daily fluctuation. Don’t panic over it. Markets move up and down every single day.
What should get your attention:
- Moves exceeding 2% in a single day (unusual)
- Consecutive days moving in the same direction (trend forming)
- Divergence between indices (DS30 up while DSEX down, or vice versa)
Volume Matters More Than Direction
A 50-point rise on ৳300 crore turnover is less meaningful than a 50-point rise on ৳1,200 crore turnover. High volume validates the direction. If DSEX is climbing but turnover is shrinking, the rally may be fragile.
Index Levels vs. Percentage Changes
Hearing “DSEX dropped 100 points” sounds alarming. But if DSEX is at 6,000, that’s only 1.67% — a normal correction. Always think in percentages, not absolute points. A 100-point drop at 3,000 (3.3%) is very different from a 100-point drop at 6,000 (1.67%).
What Indices Don’t Tell You
Indices are useful, but they have real limitations:
- They hide individual stock stories. DSEX could be flat while half the stocks in your portfolio are falling and the other half are rising. The average masks the extremes.
- They’re weighted toward large caps. A few huge companies can push DSEX up even while hundreds of smaller stocks are falling. This happens more often than you’d think.
- They don’t predict the future. A rising DSEX doesn’t mean it will keep rising. Past performance tells you what happened, not what will happen.
Practical Tips for Using Indices
- Check DSEX before trading. Know the broad market direction before placing orders. Swimming against the current is possible but harder.
- Compare your portfolio to DSEX. If DSEX rose 15% over the past year and your portfolio rose 8%, you underperformed the market. This is important to know. FinTrail shows you this comparison automatically.
- Watch the divergences. If your stocks are falling while DSEX is rising, something specific to your holdings is wrong. Investigate.
- Don’t trade based on index movements alone. DSEX dropping doesn’t mean every stock is now a bargain. Individual analysis always comes first.
FinTrail’s market dashboard displays real-time DSEX, DS30, and DSES data alongside gainers, losers, and sector performance — so you can see the full picture without switching between multiple sources.
Think About This
-
If DSEX rises 2% in a day but turnover is at a three-month low, what might that tell you about the sustainability of the move?
-
Suppose DS30 has risen 12% over six months but DSEX has only risen 4%. What does this divergence suggest about where money is flowing in the market?
-
You own a portfolio of 10 stocks. DSEX is up 18% for the year but your portfolio is up only 6%. What questions should you be asking about your stock selection?