Once you can read financial statements, the next step is knowing which numbers to extract and what they actually tell you. Four metrics form the backbone of stock valuation on the DSE: EPS, P/E ratio, NAV, and P/B ratio. Master these four, and you’ll have a solid framework for evaluating any stock.
Earnings Per Share (EPS)
EPS is the most fundamental metric in stock analysis. It tells you how much profit a company generates for each outstanding share.
EPS = Net Profit After Tax / Total Shares Outstanding
If a company earns ৳500 crore in net profit and has 20 crore shares outstanding, its EPS is ৳25.
Why EPS Matters
EPS is the foundation on which most other valuation metrics are built. A rising EPS over several years generally signals a well-managed, growing company. A declining EPS — even if revenue is growing — is a warning sign.
What to Watch For
- Consistency matters more than spikes. A company with EPS of ৳8, ৳9, ৳10, ৳11 over four years is more reliable than one showing ৳5, ৳15, ৳3, ৳12.
- Check for dilution. If a company issues new shares (through rights offerings or bonus shares), EPS can drop even if total profits grow. Always look at EPS alongside total earnings.
- Quarterly vs. annual. One strong quarter doesn’t make a trend. Look at trailing twelve-month EPS for a clearer picture.
Real DSE Context
Among DSE blue chips, you’ll find a wide EPS range. A large pharmaceutical company might have an EPS of ৳30-60, while a mid-tier bank might show ৳2-5. The absolute number isn’t what matters — it’s the trend and how the market prices it.
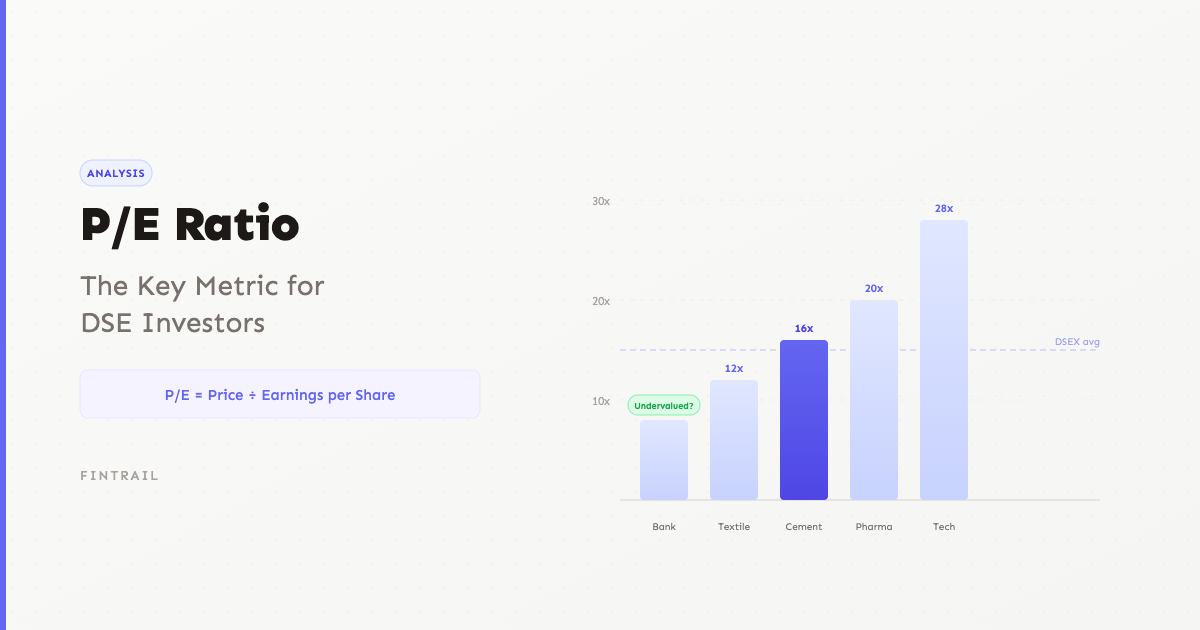
Price-to-Earnings (P/E) Ratio
The P/E ratio connects a stock’s market price to its earnings, telling you how much investors are willing to pay for each taka of profit.
P/E Ratio = Market Price per Share / EPS
A stock trading at ৳180 with an EPS of ৳12 has a P/E of 15. Investors are paying ৳15 for every ৳1 of earnings.
How to Interpret P/E
- Low P/E (below 10) — The market may see limited growth prospects, or the stock could be genuinely undervalued.
- Moderate P/E (10-20) — Fairly valued for most DSE sectors.
- High P/E (above 25) — The market expects strong future growth, or the stock may be overpriced.
Sector Benchmarks on DSE
P/E ratios vary dramatically by sector. Comparing a bank’s P/E to a pharma company’s P/E is meaningless. Here are typical DSE ranges:
- Banking: 6-12
- Pharmaceuticals: 15-25
- Cement: 12-20
- IT/Technology: 20-35
- Food & Allied: 12-18
Always compare a stock’s P/E to its sector average and its own historical range.
For a deeper dive on P/E, see our standalone guide.
Net Asset Value (NAV) Per Share
NAV tells you the book value of each share — essentially, what shareholders would theoretically receive if the company sold all assets and paid all debts.
NAV per Share = (Total Assets - Total Liabilities) / Total Shares Outstanding
If a company has ৳2,000 crore in assets, ৳800 crore in liabilities, and 10 crore shares outstanding, its NAV per share is ৳120.
Why NAV Matters
NAV represents the “floor value” of a stock, at least in theory. It’s particularly important for:
- Asset-heavy companies like banks, insurance companies, and real estate firms where tangible assets make up most of the value
- Identifying potential bargains — a stock trading below NAV might be undervalued
- Assessing financial health — a steadily growing NAV indicates the company is building shareholder wealth over time
Limitations of NAV
NAV is based on book values, which may not reflect market reality. A piece of land purchased for ৳10 crore twenty years ago might be worth ৳200 crore today, but the balance sheet still shows ৳10 crore (minus depreciation). Conversely, obsolete machinery might be carried at book value despite being worth far less.
For technology or service companies, NAV is less meaningful because their primary value lies in intellectual property, brand, and human capital — none of which appear on the balance sheet at full value.
Price-to-Book (P/B) Ratio
P/B connects the market price to the book value, telling you how much premium (or discount) investors place on a company relative to its net assets.
P/B Ratio = Market Price per Share / NAV per Share
A stock at ৳200 with a NAV of ৳100 has a P/B of 2.0. Investors value the company at twice its book value.
How to Read P/B
- P/B below 1.0 — The stock trades below its book value. Could signal an undervalued opportunity or a company the market thinks is in trouble.
- P/B of 1.0-2.0 — Reasonable for many DSE sectors.
- P/B above 3.0 — Investors expect the company to generate returns well above its asset base. Common for high-growth or high-quality businesses.
P/B on the DSE
In the banking sector, P/B is arguably more important than P/E because banks are essentially portfolios of financial assets. A well-managed bank might trade at P/B of 1.2-1.5, while a weaker one might sit below 0.8.
For pharma companies or IT firms, a higher P/B is normal because their value comes from intangibles like drug pipelines, patents, and recurring revenue — things that don’t show up fully in book value.
Putting It All Together
No single metric tells the whole story. Here’s how to use all four together:
| Metric | What It Tells You | Best For |
|---|---|---|
| EPS | Profitability per share | Earnings trend analysis |
| P/E | Price relative to earnings | Comparing valuation within a sector |
| NAV | Book value per share | Asset-heavy industries |
| P/B | Price relative to book value | Banks, insurance, real estate |
A Practical Example
Suppose you’re comparing two DSE-listed cement companies:
| Metric | Company X | Company Y |
|---|---|---|
| Price | ৳145 | ৳210 |
| EPS | ৳10.50 | ৳12.00 |
| P/E | 13.8 | 17.5 |
| NAV per share | ৳95 | ৳160 |
| P/B | 1.53 | 1.31 |
Company X looks cheaper on P/E, but Company Y has a lower P/B and significantly higher NAV. You’d want to investigate further: Is Company Y sitting on valuable land? Does Company X have better earnings growth? The metrics don’t give you the answer directly — they tell you where to dig deeper.
Using FinTrail for Valuation Analysis
FinTrail’s screener lets you filter all 400+ DSE stocks by EPS, P/E, NAV, and P/B ratio simultaneously. You can set custom ranges — say, P/E below 15 and P/B below 1.5 — to build a shortlist of potentially undervalued stocks. Combine these with sector filters and you have a systematic approach to finding opportunities.
These four metrics won’t make you an expert overnight. But they give you a clear, numbers-based framework for making investment decisions — and that’s infinitely better than relying on tips and rumors.
Think About This
- A stock has a P/E of 8 and a P/B of 0.6. Does this automatically make it a great buy? What else would you want to know before investing?
- If a company’s EPS has grown 20% per year for five years, but its P/E is 30, would you consider it expensive? How would the PEG ratio help you decide?
- Why might NAV be misleading for a software company compared to a cement company? What metric would you rely on instead?