If you could only learn one financial metric, it should be the Price-to-Earnings ratio. The P/E ratio is the single most widely used valuation tool in stock analysis, and understanding it can dramatically improve your investment decisions on the DSE.
What is the P/E Ratio?
The P/E ratio tells you how much investors are willing to pay for each taka of a company’s earnings. It’s calculated as:
P/E Ratio = Market Price per Share ÷ Earnings per Share (EPS)
For example, if a stock trades at ৳120 and its EPS is ৳10, the P/E ratio is 12. This means investors are paying ৳12 for every ৳1 of earnings.
Why Does It Matter?
The P/E ratio helps you answer a fundamental question: Is this stock expensive or cheap relative to its earnings?
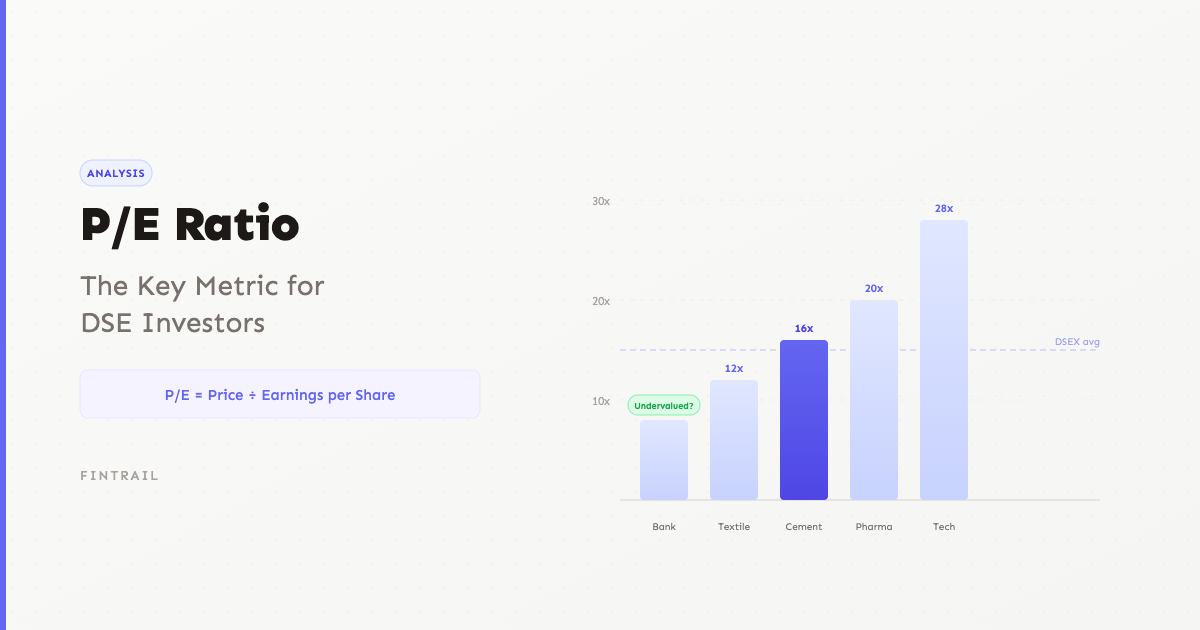
- A low P/E (below 10-12 on DSE) might suggest the stock is undervalued — or that the market expects declining earnings
- A high P/E (above 25-30) might mean the stock is overvalued — or that investors expect strong future growth
- The average DSE P/E typically ranges between 14-18, though this varies with market conditions
Types of P/E Ratio
Trailing P/E
Uses the last 12 months of actual earnings. This is the most common and reliable since it’s based on real numbers.
Forward P/E
Uses estimated future earnings. Useful for fast-growing companies but relies on analyst predictions, which can be wrong.
How to Use P/E on the DSE
1. Compare Within the Same Sector
A bank with a P/E of 8 and a pharma company with a P/E of 20 aren’t directly comparable. Different sectors have different typical P/E ranges:
- Banking: 6–12
- Pharmaceuticals: 15–25
- Cement: 12–20
- Textiles: 8–15
- Technology: 20–35
Always compare a stock’s P/E to its sector average.
2. Look at Historical P/E
Check how a stock’s current P/E compares to its own historical range. If a stock typically trades at a P/E of 15 but is currently at 10, it might be worth investigating why.
3. Consider Earnings Quality
A low P/E means nothing if the earnings aren’t sustainable. Check whether earnings come from core operations or one-time gains. Look at trends over 3–5 years rather than a single quarter.
4. Factor in Growth
A stock with a P/E of 25 might actually be cheap if its earnings are growing at 30% per year. The PEG ratio (P/E divided by earnings growth rate) helps account for this — a PEG below 1 often suggests good value.
P/E Ratio Pitfalls
- Negative earnings make P/E meaningless — you can’t use it for loss-making companies
- Cyclical businesses may show low P/E at peak earnings (a value trap) and high P/E at trough earnings (potentially a buying opportunity)
- Accounting differences can distort earnings between companies
- P/E alone is never enough — always combine it with other metrics like P/B ratio, dividend yield, and debt levels
Practical Example
Let’s say you’re comparing two DSE-listed pharmaceutical companies:
| Metric | Company A | Company B |
|---|---|---|
| Price | ৳250 | ৳180 |
| EPS | ৳12.50 | ৳15.00 |
| P/E | 20 | 12 |
| EPS Growth (3yr) | 8% | 15% |
| PEG | 2.5 | 0.8 |
Company B looks more attractive — it has a lower P/E, higher EPS, stronger earnings growth, and a PEG ratio below 1. Of course, you’d want to investigate further before making any investment decision.
Using FinTrail for P/E Analysis
FinTrail’s stock screener lets you filter all 400+ DSE stocks by P/E ratio, compare within sectors, and track historical valuations. Combine P/E with other fundamental filters to build a shortlist of potentially undervalued stocks.
The P/E ratio isn’t a magic formula, but it’s an indispensable starting point for any serious investor. Master it, and you’ll make more informed decisions about which DSE stocks deserve your hard-earned money.